


1. Keep perspective: Downturns are normal
- Historically, US stocks have experienced 3 downturns of 5% per year, 1 correction of 10% per year, and 1 correction of ~15% every 3 years.
- While market downturns may be unsettling, history shows stocks have recovered and delivered long-term gains.

Past performance is no guarantee of future results. Source: FMRCo, Bloomberg, Haver Analytics, FactSet. Data as of December 31, 2025.1 The S&P 500 Index is a market capitalization–weighted index of 500 common stocks chosen for market size, liquidity, and industry group representation. S&P and S&P 500 are registered service marks of Standard & Poor's Financial Services LLC. You cannot invest directly in an index.
2. Get a plan you can live with – through market ups and downs
- Your mix of stocks, bonds, and short-term investments will determine your potential returns, but also the likely swings in your portfolio.
- Pick an investment mix that aligns with your goals, timeframe, risk tolerance, and financial situation, and you can stick with despite market volatility.
Choose an investment mix you are comfortable with

Data source: Fidelity Investments and Morningstar Inc. 2024 (1926–2024).2 Past performance is no guarantee of future results. Returns include the reinvestment of dividends and other earnings. This chart is for illustrative purposes only. It is not possible to invest directly in an index. Time periods for best and worst returns are based on calendar year. For information on the indexes used to construct this table, see data source.2 The purpose of the target asset mixes is to show how target asset mixes may be created with different risk and return characteristics to help meet a participant's goals. You should choose your own investments based on your particular objectives and situation. Remember, you may change how your account is invested. Be sure to review your decisions periodically to make sure they are still consistent with your goals. You should also consider any investments you may have outside the plan when making your investment choices.
3. Focus on time in the market – not trying to time the market
- It can be tempting to try to sell out of stocks to avoid downturns, but it’s hard to time it right.
- If you sell and are still on the sidelines during a recovery, it can be difficult to catch up. Missing even a few of the best days in the market can significantly undermine your performance.
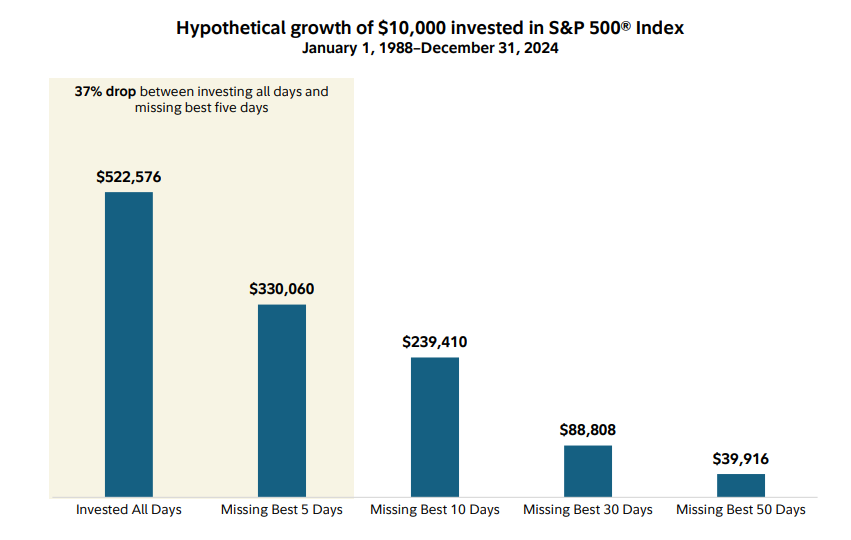
Past performance is no guarantee of future results. Source: Fidelity, Bloomberg as of 12/31/24. This is based on the cumulative percentage return of a hypothetical investment made in the noted index during periods of economic expansions and recessions. Index returns include reinvestment of capital gains and dividends, if any, but do not reflect the impact of taxes, fees, or expenses, which would lower these figures. This return information is not intended to imply any future performance of the investment product. "Best days" were determined by ranking the one-day total returns for the S&P 500® Index within this time period and ranking them from highest to lowest. There is volatility in the market and a sale at any point in time could result in a gain or loss. See important information for index definitions. Your own investment experience will differ, including the possibility of losing money. It is not possible to invest directly in an index. All indexes are unmanaged. Source: Bloomberg, S&P 500 Index® total return for 12/31/49 to 12/31/24; recession and expansion dates defined by the National Bureau of Economic Research (NBER). The S&P 500 Index was created in 1957; however, returns have been reported since 1926, and the index has been reconstructed for years prior to 1957.
4. Invest consistently, even in bad times
- Some of the best times to buy stocks have been when things seemed the worst.
- Consistent investing can give you the discipline to buy stocks when they are at their cheapest.
- Consider setting a plan for automatic investments.
Investing during recessions has historically led to strong investment results

For illustrative purposes only. Recession dates from the National Bureau of Economic Research (NBER). Past performance is no guarantee of future results. It is not possible to invest directly in an index. All indexes are unmanaged. See footnote 3 for index information. S&P 500 index monthly total returns from 12/31/49 to 12/31/19. Source: Bloomberg Finance, L.P.
5. Get help to make the most of a down market
- While no one likes to lose money, your financial advisor may be able to help you take advantage of a down market.
- Tax rules may let you use losses on some of your investments to reduce your future tax bills or use lower share prices to convert to a Roth IRA at a lower tax cost.
- Down markets may also be a good time to meet with your advisor to discuss adjusting your investment mix or taking advantage of opportunities when prices are low.
6. Consider a hands-off approach
- If you are not comfortable with market risk, consider turning your portfolio over to a professional through a managed account or all-in-1 mutual fund.
- If you don't have a strategy, or think yours may be off track, start planning now with our online tools. Or schedule an appointment with a Fidelity representative. We can help.