A company's earnings report is one of the most important events for investors and traders. Earnings reports have the potential to cause significant price swings. Indeed, it is not unusual for a significant increase or decrease in a stock price to occur immediately after an earnings report.
Make your stock forecast
The first step when trading earnings with options is to determine what direction you think the stock could go. This forecast is crucial because it will help you narrow down which options strategies to choose.
There are options strategies for price moves to the upside, downside, and even if you believe the stock won’t move much at all. For example, if you expect that there will be a positive price move after an earnings report, you could buy call options. Alternatively, if you expect that there will be a negative price move after an earnings report, you could buy put options.
Know your options
Trading options involves more risk than buying and selling stock, and only experienced, knowledgeable investors should consider using options to trade an earnings report. Traders should fully understand moneyness (the relationship between the strike price of an option and the price of the underlying asset),1 time decay, volatility, and options Greeks in considering when and which options to purchase before an earnings announcement.
Volatility forecast
In addition to assessing which direction a stock might go, consider the magnitude of volatility the stock may exhibit around an earnings report. In this regard, volatility can be considered how far a stock price moves from some average.
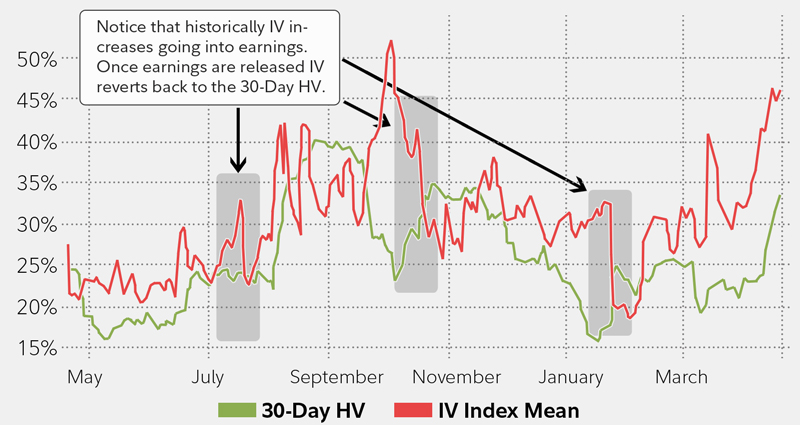
To see why volatility is so important, check out the chart below which shows 30-day historical volatility (HV) versus implied volatility (IV) going into an earnings announcement for a particular stock. Historical volatility is the actual volatility experienced by a security. Implied volatility can be viewed as the market's expectation for future volatility.2 The earnings periods for July, October, and January are shaded.
Consider the Greeks and implied volatility when trading options going into an earnings release

Notice in the period going into earnings there was a historical increase of approximately 14% in the IV, and once earnings are released, the IV has returned to approximately the 30-day HV. This is intended to show that volatility can have a major impact on the price of the options being traded and, ultimately, your profit or loss. Essentially, the closer to an earnings report, the greater the potential volatility—and consequently, the more expensive an options contract will be, relative to time periods further away from an earnings report.
Options for existing positions
Once you've made your stock and volatility forecast, it's time to start thinking about the type of position you believe might capitalize on this forecast. Is it a net new position or are you managing an existing position?
If you are already in a stock that is expected to report earnings in the near future, you can use options to hedge, or reduce exposure to, existing positions before an earnings announcement.
For instance, if you are in a short-term long stock position (e.g., you own the stock and have a short-term outlook), and expect the stock to be volatile to the downside immediately after an upcoming earnings announcement, you could purchase a put option to offset some of the expected volatility. This is because if the stock were to decline in value, the put option would likely increase in value.
Advanced options strategies
If you are considering a new options position in advance of an earnings announcement, the simplest way to trade it is by purchasing calls if you think the price is going to increase above the current price, or to purchase puts if you think the price is going to decrease below the current price. There are additional decisions to make, such as determining the impact of a change in implied volatility, picking the optimal expiration date, selecting the strike price, and choosing the right size of the trade.
In addition to buying calls and puts, there are several multi-leg advanced strategies that can be constructed to trade earnings, including straddles, strangles, and spreads.3
Straddles —A straddle can be used if a trader thinks there will be a big move in the price of the stock, but is not sure which direction it will go. With a long straddle, you buy both a call and a put option for the same underlying stock, with the same strike price and expiration date. If the underlying stock makes a significant move in either direction before the expiration date, you can make a profit. However, if the stock is flat, you may lose all or part of the initial investment.
For example, suppose a stock is trading at $87.50. To construct a long straddle, you might buy 1 87.50 call for $2.15 and buy 1 87.50 put for $1.85 for a net cost (i.e., maximum loss) of $4.00 per contract (which equates to $400). This stock has unlimited upside potential, with breakeven prices of $83.50 and $91.50. You would earn a profit if the stock moves above or below these breakeven prices after the earnings announcement.
This options strategy can be particularly useful during an earnings announcement when a stock’s volatility tends to be higher. However, options prices with high volatility tend to be more expensive and can impact the potential profitability. If a fall in implied volatility impacts the options price more than the move in the price of the underlying security, the option strategy may become unprofitable after the announcement, even if the stock moves significantly. All of the same can be said for a similar options strategy known as the strangle.
Strangles —Like the long straddle, a long strangle is an options strategy that enables a trader to profit if there is a big price move for the underlying stock. The primary difference between a strangle and a straddle is that a straddle will typically have the same call and put exercise price, whereas a strangle will have 2 different exercise prices.
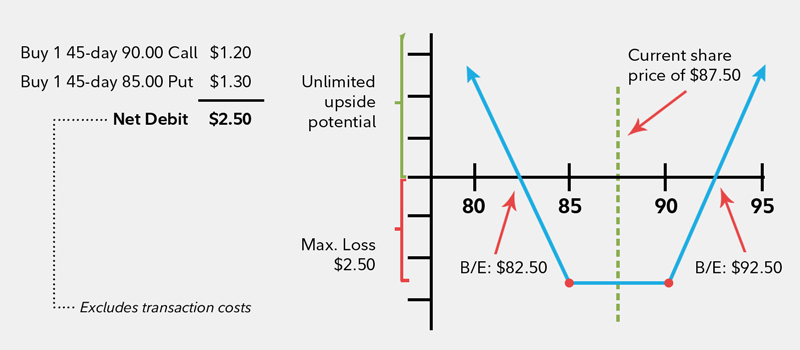
Using the same example, suppose a stock is trading at $87.50. To construct a long strangle, you might buy 1 90 call for $1.20 and buy 1 85.00 put for $1.30 for a net cost (i.e., maximum loss) of $2.50 per contract (see Long strangle example). This stock has unlimited upside potential, with breakeven prices of $82.50 and $92.50. You would earn a profit if the stock moves above or below these breakeven prices after the earnings announcement.
Long strangle example

Spreads —A spread is a strategy that can be used to profit from volatility in an underlying stock. Different types of spreads include the bull call, bear call, bull put, and bear put.
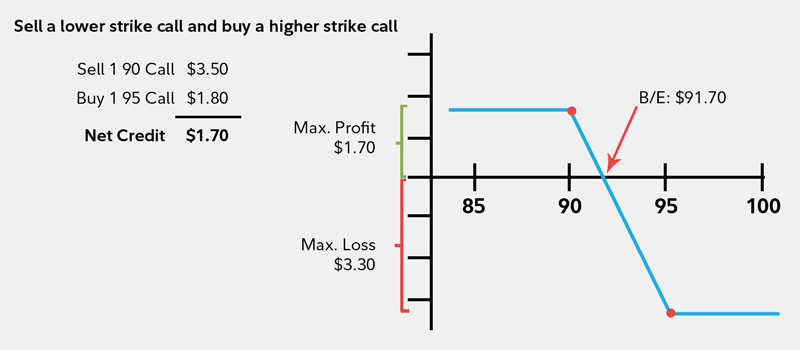
Consider a call credit spread where the stock is trading at $88.50. You could sell a 90 call for $3.50 and buy a 95 call for $1.80 for a net credit of $1.70 (see Call credit spread example). The breakeven is $91.70. Here, you would be looking for the stock to stay below the 90 strike price so that you can keep the credit of $1.70 per contract (maximum gain), and your maximum loss is limited to $3.30 per contract and is only realized if stock rises above 95.
Call credit spread example

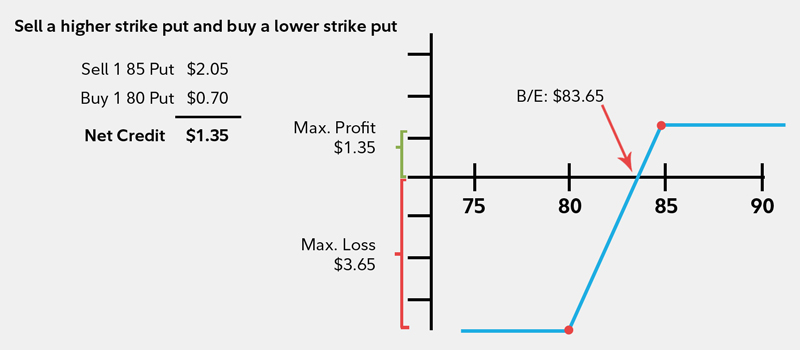
For a put credit spread, you could sell an 85 put for $2.05 and buy an 80 put for $0.70 for a net credit of $1.35 per contract (see Put spread example). The breakeven is $83.65. Here, you would be looking for the stock to stay above the 85 strike so that you can keep the credit of $1.35 per contract (maximum gain), and your maximum loss is limited to $3.65 per contract if the stock falls below $80 strike price.
Put credit spread example

Finding opportunities
Information about when companies are going to report their earnings is readily available to the public. More in-depth research is required to form an opinion about how those earnings will be perceived by the market.
Of course, traders can be exposed to significant risks if they are wrong about their expectations. The risk of a larger-than-normal loss is significant because of the potential for large price swings after an earnings announcement. Options can magnify those losses. Any strategy should be considered within the context of your individual investing or trading plan. If you know the types of strategies that are available, you can choose the right one for your investing and trading goals.
A company's earnings report is a crucial time of year for investors. Expectations can change or be confirmed, and the market may react in various ways. If you are looking to trade earnings, do your research and know what options are at your disposal.


