Context Analytics (CA) was founded in 2012 and is a leader in providing predictive analytics based on data derived from social media inputs. CA filters, structures, and quantifies social media information for capital markets. CA's patented filtering process scans social media for relevant information from sources CA believes to be relevant. CA then produces a data stream of proprietary metrics called "S-Factors™" to give users the full context of social media conversations. CA data provides indicators of market volatility and sentiment levels for traders using directional movement and volatility strategies.
Methodology
Social media is a rapidly growing means of communication that has gained acceptance among professional users in capital markets and now represents a large source of signal rich data. Unfortunately, the vast size of this data, given the volume, makes social media a difficult data set to use for trading if not analyzed and quantified properly. By filtering, effectively cleaning, rigorously analyzing, and aggregating this information, valuable insights may be gained.
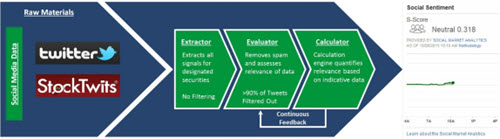
CA employs a three stage processing pipeline to mine S-Factors™ from the Twitter message stream. The Extractor pulls messages for equities in the CA stock universe, also referred to below as "designated securities", from the Twitter and StockTwits APIs. CA processes metadata in addition to the messages, allowing CA to further categorize and add context for further processing. The Evaluator measures the validity of the Twitter account and the sentiment of the message. The output from the Extractor is a set of scored messages. The Calculator takes the individually scored messages and calculates the S-Factor family of metrics from those messages. This process is performed 24/7 for all companies in the CA stock universe yielding estimates at one minute intervals throughout each day, and is illustrated below.
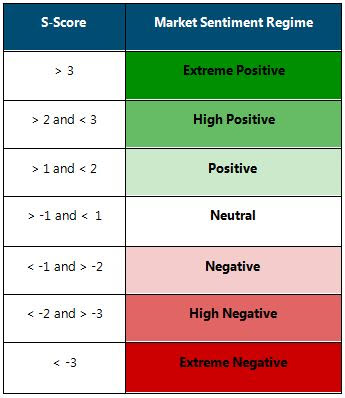
In general, positive S-Scores™ are associated with favorable changes in investor sentiment, while negative levels are associated with unfavorable changes. Sentiment changes oftentimes result in stock price changes.
S-Score™: Is the normalized representation of a sentiment time series over a lookback period. The S-Score™ is a measure of the deviation of a stock's sentiment intensity level from a normal state. The S-Score™ answers the question, "Is the conversation on Twitter significantly more positive or negative than normal for that specific stock?". Higher levels of sentiment indicate a stronger reaction. High positive indicates that a security is statistically likely to move higher. Conversely a strongly negative sentiment indicates that the security is statistically likely to go lower.
In summary, CA factors can be used to gauge the sense of market participants. CA S-Factors provide a real time view of the pulse of the market.