Equity Summary Score
Analyst Opinions
Equity Summary Score
Equity Summary Score
1 of 3  Next
Next 
- What is it?
- The Equity Summary Score provides a consolidated view of the ratings from a number of independent research providers on Fidelity.com. It uses the providers' relative, historical recommendation performance along with other factors to give you an aggregate, accuracy-weighted indication of the independent research firms' stock sentiment.
- How It Works
- The StarMine model underlying the Equity Summary Score has a few key components.
- Normalize - Look at the research providers' buy and sell ratings distributions to understand which ratings are scarce and therefore may be more important.
The distribution of ratings from each of the independent research firms are normalized to make them more comparable with each other. For example, some research providers may issue a large number of buy recommendations and few sell recommendations, or vice versa. StarMine adjusts for this by overweighting "scarce" ratings and underweighting "plentiful" ratings. By normalizing the distribution of ratings, the model can recognize the "scarcity value" of ratings that are infrequently given which adds additional information to the model.
- Weight - Look at the 24 month relative firm/sector ratings accuracy and use that information to determine which firms' ratings have the most weight in the aggregated Equity Summary Score.
- Calculate - The normalized analysts' recommendations and the accuracy weightings are combined to create a single score. For the largest 1,500 stocks by market capitalization, these scores are then forcibly ranked against all the other scores to create a standardized Equity Summary Score on a scale of 0.1 to 10.0 for the 1,500 stocks. This means that there will be a uniform distribution of scores provided by the model thereby assisting investors in evaluating the largest stocks [in terms of capitalization], which typically make up the majority of individual investors portfolios. Finally, smaller cap stocks are then slotted into this distribution without a force ranking, and may not exhibit the same balanced distribution.
- Normalize - Look at the research providers' buy and sell ratings distributions to understand which ratings are scarce and therefore may be more important.
- Making It Work For You
- There are many ways to use the Equity Summary Score. You can use it as a screening criterion, to help identify stocks you may want to include or exclude from further analysis, in conjunction with other criteria. You can also use it to monitor the consolidated opinion of the independent research firms that are following the stocks you are currently holding in your portfolio.
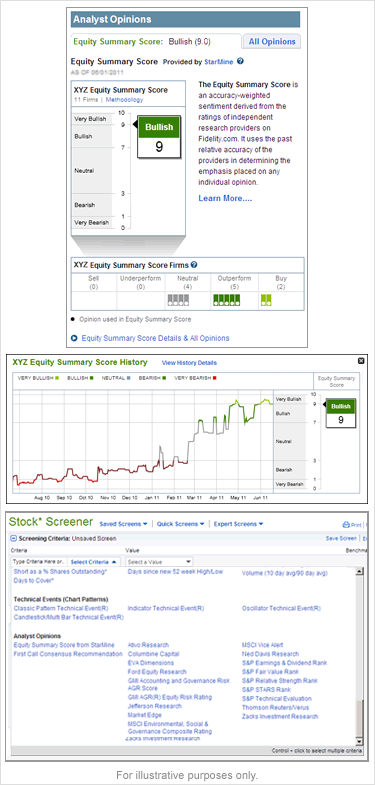
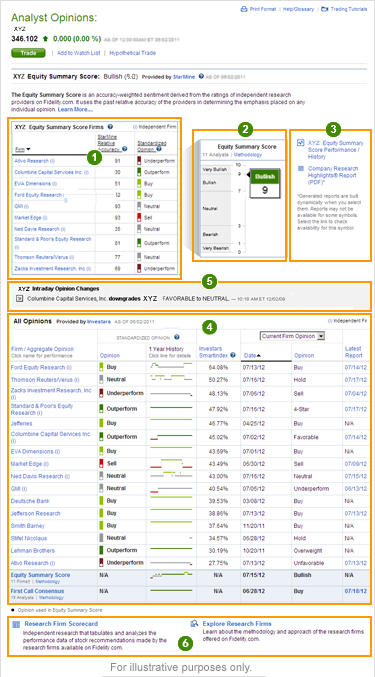
- Equity Summary Score Firms
- This is a list of the independent research firms included in the Equity Summary Score. The standardized opinion and StarMine Relative Accuracy Score is provided for each firm. Click on the "?" icon for definitions.
- Equity Summary Score
- The Equity Summary Score is the consolidated, accuracy-weighted indication of the independent research firms' sentiment for this stock. Click on "Methodology" to learn more on how StarMine calculates the Score.
- Equity Summary Score Performance and History
- View 12 month history and associated price performance
- All Opinions Table
- This section provides a list of all available opinions for this stock on Fidelity.com. Columns are sortable. You will find:
- The name of the firm, designated with an "(i)" when the firm is independent. You can click the firm name to view opinion history and performance.
- The firm's standardized opinion. A dot in the colored bar indicates the firm is included in the calculation of the Equity Summary Score. Investars, a third-party research firm collects and standardizes opinions using a five-point scale to make it easier for you to compare firm opinions.
- The 1 Year History line shows you if the firm's standardized opinion has changed or remained the same over the last year. Click for full chart and access details.
- The StarMine Relative Accuracy Score is a measure of the relative historical accuracy of the firm's opinions in the stock's sector among its peers over the last 24 months.
- The date refers to the date of the firm's most recent non-standardized opinion, which is shown in the next column. You can change the view to see the last time the opinion changed and if it was an upgrade or downgrade.
- A link to the latest research report (in PDF format) is available from firms Fidelity may distribute.
- Intraday Opinions
- Opinions provided on this page are up to date as of the previous trading day. Opinion changes issued during the current trading day, if any, will be listed above the All Opinions table.
- Research Firm Scorecards and Explore Research Firms
- These scorecards show theoretical performance of independent research firm ratings over time, individually and in aggregate. They may help you to understand and compare the historical accuracy of recommendations.
- Explore Research Firms may be useful to help you understand the varying objectives, styles, and approaches of the research that Fidelity offers.
Scorecards
 Previous 3 of 3
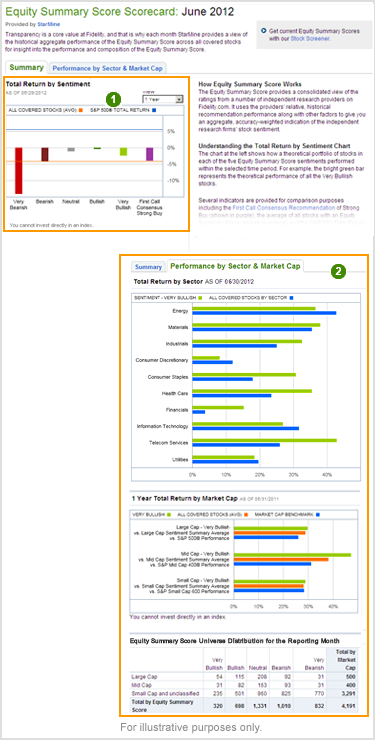
- Equity Summary Scorecard Summary
- A Total Return by Sentiment chart shows how a theoretical portfolio of stocks in each of the five sentiments performed within the selected time period. For example, the bright green bar represents the performance of all the Very Bullish stocks. Several indicators are provided for comparison purposes including the First Call Consensus Recommendation of Strong Buy (shown in purple), the average of all stocks with an Equity Summary Score (shown in orange) and the S&P 500® Total Return Index (shown in blue).
- Performance by Sector and Market Cap
- Fidelity customers have access to more in-depth analysis of the Equity Summary Score universe and performance.
- The Total Return by Sector chart provides the historical performance of a theoretical portfolio of Very Bullish stocks in each sector over the time period selected. For comparison, the average performance of all stocks with an Equity Summary Score during the time period by sector is also provided.
- The Total Return by Market Cap shows the historical performance by market capitalization for stocks with an Equity Summary Score of Very Bullish as compared to typical market benchmarks as well the average for the largest 500 stocks, the next smaller 400 stocks, and the next 600 smaller stocks by market capitalization.
- The last table is the Equity Summary Score universe distribution for the reporting month by market capitalization and score.
- The Theoretical Portfolio of stocks is equal dollar weighted. Performance is adjusted for dividends and corporate actions. Performance does not include monthly theoretical portfolio rebalancing transaction costs. More details on performance data in Understanding and Using the Equity Summary Score Methodology (PDF).