How We’ve Improved Stock Research
Fidelity offers the tools and data you need to successfully navigate the markets. Our enhanced stock research pages let you access this information all in the same place, making your research and analysis faster and easier.
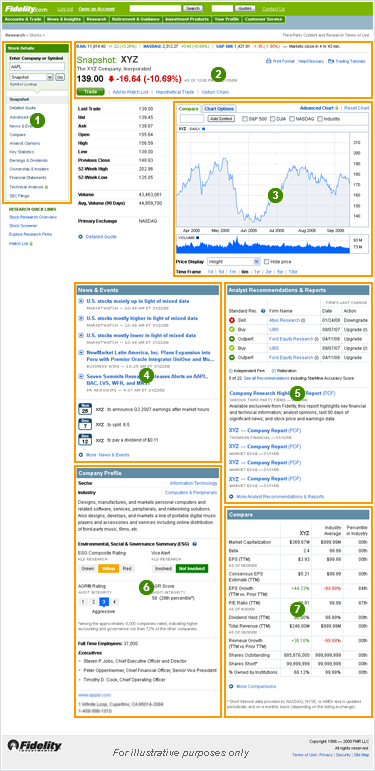
A Better Stock Snapshot
1 of 5  Next
Next 
- New Table of Contents
- You now have easy access to all stock detail pages.
- Stock Quote
- Shows current price, change, and market index information, allowing you to trade, update your watch list, try a hypothetical trade, or review the option chain from any page.
- Interactive Charting
- Conveniently located next to the stock quote information. If you’re logged in, advanced charting with technical indicators is just a click away.
- News & Events
- Gives you the most recent news stories related to the stock, as well as news of earnings, dividends, splits, and meeting announcements.
- Analyst Recommendations & Reports
- Once you’re logged in, access reports and recommendations from the most accurate analysts, with a snapshot of their most recent actions. A complete list of reports and recommendations is just a click away.
- Company Profile
- Now includes links to the stock’s sector and industry, as well as Environmental, Social & Governance Summary (ESG) ratings, top executives, company location and URL.
- Compare
- A new feature that compares the stock to its industry across key statistical benchmarks.
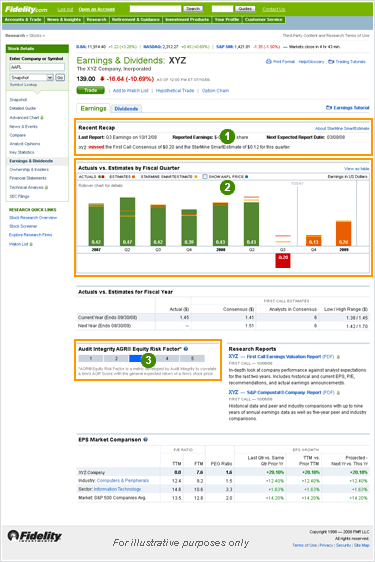
The in–depth historical data and earnings estimates you’ve been asking for.
- Recent Recap
- Find answers to your questions about recent earnings activity. What was reported? When? Did they meet, miss, or exceed expectations? When is the next expected earnings announcement? It’s all here.
- Actuals vs. Estimates Chart
- Two years of historical earnings data and one year of forecasted earnings. Roll over any bar in the chart to see details of actuals versus estimates for that quarter. Overlay price movement on the chart with a click. Log in to see the StarMine SmartEstimate.
- Audit Integrity AGR® Equity Risk Factor
- This AGR® Score helps you gauge whether accounting and governance risk factors could have an impact on share price performance — a feature you won’t find with any other online retail broker. The First Call Earnings Valuation and S&P Compustat® reports provide additional in–depth analysis and data.
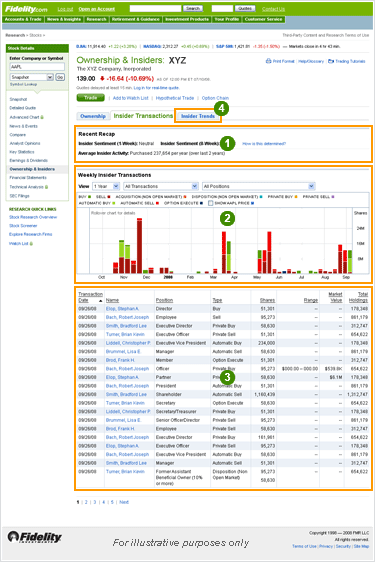
We’ve expanded our Ownership & Insiders offerings to provide Insider Sentiment & Trends.
- Recent Recap
- Lets you know what the insider sentiment has been for this stock, and reveals the average insider’s activity.
- Interactive Insider Transactions Chart
- Explore one or two years’ worth of weekly insider transactions by transaction type and insider. Roll over any bar for details of the trades. Overlay price movement on the chart with a click.
- Transaction Details
- See who has been doing what. Roll over an insider’s name to see up to five of their last transactions over the past two years.
- Insider Trends
- New functionality that let’s you see predictive insiders’ activity and the average 6–month return of this activity.
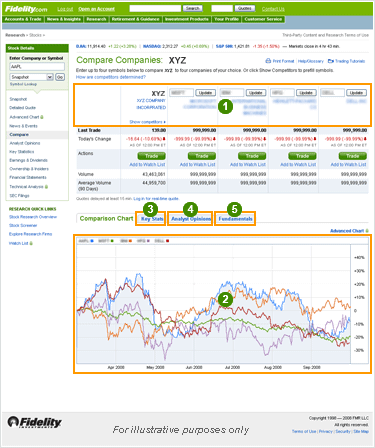
- Make your choice
- Click Show Competitors or enter up to 4 symbols to see the most recent pricing and volume data.
- Comparison Chart
- Compare companies’ price movements for the last year.
- Key Stats Tab
- See how the companies compare on key data points.
- Analyst Opinions Tab
- Compare the most accurate analyst recommendations and consensus earnings estimates for each company.
- Fundamentals Tab
- Compare dividends, growth, profit margins, returns, debt, and operating metrics for each chosen company.
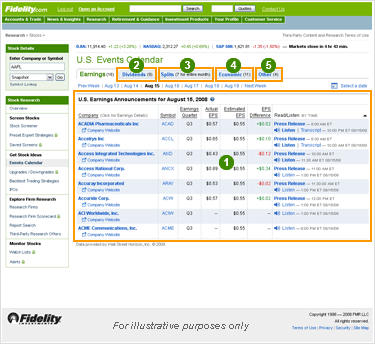
U.S. Events Calendar
 Previous
  5 of 5
The U.S. Events Calendar is a convenient and timely listing of key stock events and economic news that may impact stock prices.
- Earnings
- Find out which companies are announcing earnings today, and see how they’ve done. View historical earnings information or learn when the next announcement is expected. If available, a link is provided to the company’s press release and earnings conference call.
- Dividends Tab
- Shows which companies went ex–dividend today, along with their dividend payment.
- Splits Tab
- See which companies had a stock split during the month.
- Economic Tab
- A list of key economic announcements today with a link to the full calendar and event details.
- Other Tab
- Provides a list of events such as analyst days/investor conferences and board of directors or shareholder meetings. If available, a link will be provided to the conference call for the event.
