Improved Advanced Charting — More Interactive, Better Analysis
- More Interactive Charting
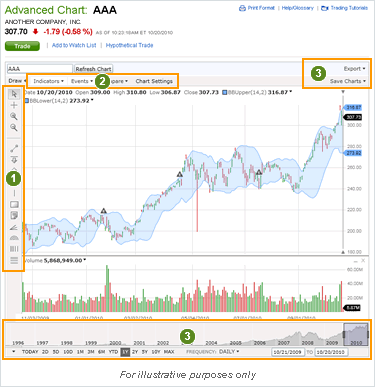
- The new chart gives you a richer, interactive charting experience to help you make investment decisions. In addition to trend lines, you can now add Fibonacci retracement and support and resistance lines. Zoom in to areas to inspect price action more closely, or add text notes to your chart as reminders.
- Better Technical Analysis
- Add power to your technical analysis with a wider range of indicators, modify indicator values in the chart, or create a customized indicator by combining other indicators.
- More Customization
- Choose the level of detail you'd like your chart to display, as well as the time period you'd like to focus on. Use the slider to control the amount of data visible in the chart. Save your customized chart or export your data for further analysis.

Advanced charting is intended to help self-directed investors evaluate stocks. Information supplied or obtained from advanced charts is for informational purposes only and should not be considered a recommendation or endorsement by Fidelity of any security or investment strategy. Fidelity does not endorse or adopt any particular investment strategy or approach to evaluating stocks. Determine which securities are right for you based on your investment objectives, risk tolerance, financial situation and other individual factors and re-evaluate them on a periodic basis.
Past performance is no guarantee of future results.
