Estimate Time8 min

Seeking protection with alternative investments

Key takeaways

  • With a more comprehensive understanding of the range of alternatives and their key attributes, investors may be better equipped to determine which, if any, may be appropriate for their portfolios.
  • We found that private alternatives demonstrated higher returns than most other asset categories, while certain liquid alternative strategies provided strong diversification benefits, especially during periods of poor public equity performance.
  • The broad range of investment outcomes of some alternative strategies suggests that investors may want to consider diversified exposure to alternatives.

Individual investors looking for new ways to potentially enhance their portfolio's returns, manage risk, and improve diversification may want to take a cue from large, institutional investors, such as pension funds, endowments, and foundations. According to a Fidelity survey of these institutions, 86% of respondents said that they invest in alternative strategies.1

For many years, alternative investment strategies were largely available only to these institutional investors. Additionally, alternatives are generally less liquid (that is, not as easy to buy or sell) than traditional investments, which has made access to them more complicated. This lack of access to alternatives has been one of the major roadblocks to their widespread adoption. But asset managers have accelerated their efforts to develop and offer innovative investment vehicle structures that can grant a broader spectrum of investors access to alternatives—some in the form of mutual funds and exchange-traded funds (ETFs).

Because of their exclusivity, some investors have felt that alternatives were too complex or too cumbersome for their portfolios or were not convinced that the historical returns and risk attributes of these investments made it worth their while. But with a more comprehensive understanding of the range of alternative investments and their key attributes, investors may be better equipped to determine which, if any, may be appropriate for their portfolios. With that in mind, it's important to note that there can be more risks associated with these relatively complex investment types and that they are not suitable for all investors.

Insights from Fidelity Wealth Management

Get our exclusive Fidelity perspective with Insights from Fidelity Wealth ManagementSM


What is an "alternative" investment?

As the name implies, alternative investments (alternatives), are those that do not fall into one of the conventional investment categories of stocks, bonds, and cash. Generally, there are 5 main categories of alternative investments. While not an exhaustive list, what follows is an overview of the alternative investment landscape:

  • Liquid alternatives and hedge funds strategies often invest in public equities and bonds, but may also hold privately held assets or derivatives (financial instruments based on agreements or contracts and whose value is tied to an underlying asset, instrument, or index), with the goal of generating returns that are uncorrelated to traditional asset markets.
  • Private equity is, in general, the investment in companies that are not traded in public markets. Investors can make direct investments in a private company or invest in a private equity fund. Unlike traditional public equity, private equity investors typically need to hold an investment for multiple years to gain value before exiting positions.
  • Private credit, like private equity, generally refers to investments that are originated or negotiated privately, are not traded on public markets, and are often composed of higher-yielding securities. This can include direct lending, whereby investors lend money directly to private companies. The borrowers are typically small and mid-sized private companies while the lenders may be institutions or asset management firms.
  • Real assets encompass a diverse range of assets including private real estate, fine art, collectibles, commodities, and investments in infrastructure, such as bridges, highways, pipelines, airports, and data centers.
  • Digital assets, or cryptocurrencies, such as bitcoin, are designed to work as mediums of exchange that are stored on a decentralized ledger known as a blockchain.

There are also numerous subcategories that represent different approaches to each strategy.

Liquid Alternatives and Hedge Funds Private Equity Private Credit Real Assets Digital Assets
  • Equity hedge
  • Relative value
  • Event driven
  • Macro
  • Buyout
  • Venture capital
  • Growth equity
  • Secondaries
  • Direct lending
  • Distressed debt
  • Collateralized loan obligations
  • Mezzanine debt
  • Opportunistic credit
  • Private real estate
  • Commodities
  • Infrastructure
  • Fine art/collectibles
  • Cryptocurrencies
  • Stablecoins
  • Central bank digital currencies
  • Non-fungible tokens

Investors may gain access to illiquid alternatives through direct investments or in a private vehicle structure, such as a limited partnership. These vehicles may be available only to investors that meet certain net worth, asset, and/or income minimums and can be highly illiquid, with lockup periods that limit investors' access to their capital.

Because the investment vehicles for alternative strategies are typically not traded on public markets like their traditional counterparts (e.g., a mutual fund or ETF), they often cannot be readily converted to cash. However, there are "liquid alternatives," which are alternative investment strategies that are structured as mutual funds, ETFs, and collective investment trusts (CITs) that offer daily pricing and liquidity. Many of these are hedge-fund-like strategies that are uncorrelated with public markets and seek to provide investors with sources of diversification beyond traditional asset classes.

Investors should consider whether liquidity may come at a cost. If illiquid assets are offered in liquid vehicle structures, there may be trade-offs over time between greater liquidity and the underlying exposures investors are seeking when allocating to alternatives.

Why own alternatives?

To explore the roles that individual categories of alternatives can play in multi-asset-class portfolios, we analyzed the historical risk, return, and correlation statistics of 18 traditional and alternative investment categories, representing alternatives with the following: Liquid alternatives, private equity, private credit, and real assets from 2005 through 2023.2 We found that within multi-asset class portfolios, individual categories of alternatives have historically offered enhanced returns, lesser downside among poor public equity performance, or diversification, among other potential benefits.3

That said, it's important to note that alternative investment strategies generally have a much shorter historical track record than their more traditional counterparts, and thus much less data than we typically evaluate when approaching strategic asset allocation decisions. The track records for bitcoin and other digital assets, in particular, are so short that we have excluded them from our quantitative analysis.

The potential for enhanced returns

Our research indicated that private equity (represented by equity-generalist, buyout, and venture capital) outperformed all other traditional and alternative asset categories over the period studied.
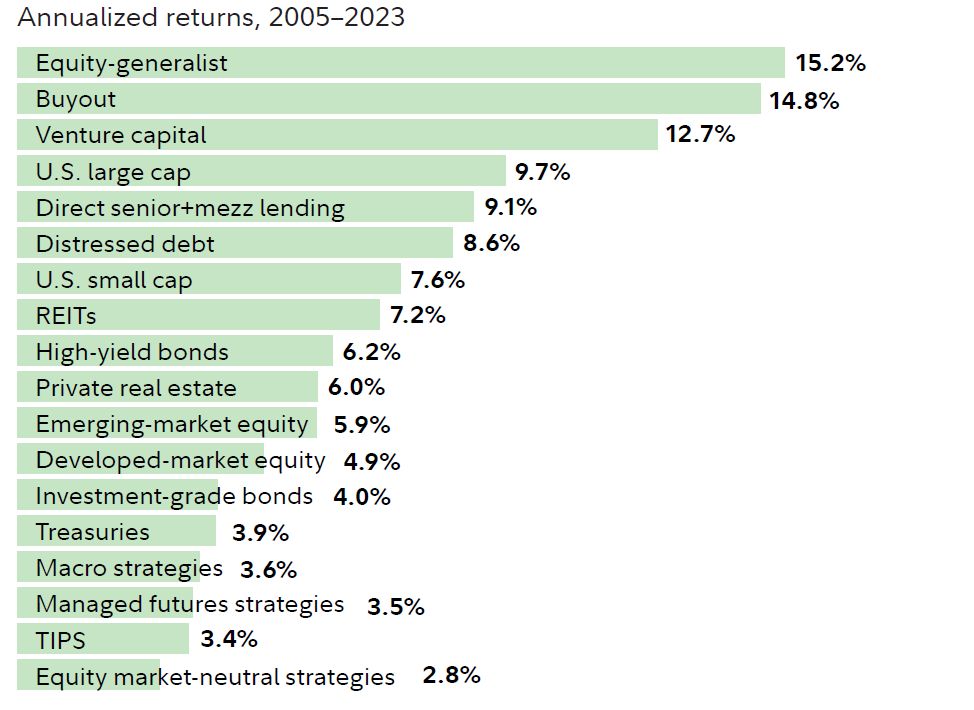
Chart shows annualized returns between 2005 and 2023 for various asset categories, with Equity-generalist showing the highest returns, at 15.2% and market neutral hedge fund strategies showing the lowest, at 2.8%.
Past performance is no guarantee of future results. Traditional asset categories: U.S. large cap equity—Russell 1000 Index; U.S. small cap equity—Russell 2000 Index; developed-market equity—MSCI EAFE Index; emerging-market equity—MSCI Emerging-Market Index; Treasuries—Bloomberg U.S. Long Treasury Index; Treasury inflation-protected securities—Bloomberg U.S. Treasury Inflation Linked Bond Index; U.S. Investment-Grade Bonds—Bloomberg U.S. Credit Index; high-yield bonds—ICE BofA U.S. High Yield Index; REITs—FTSE NAREIT All Equity REIT Index. Alternative categories: liquid alternatives—HFRI Macro Total Index and HFRI EH Equity Market Neutral Index; managed futures: SG CTA Index (note, there may be managed futures strategies in both the HFR and SG indexes); private equity—equity-generalist, buyout, and venture capital reflect annual return data from MSCI Private Assets; private credit—direct senior+mezz lending, and distressed debt reflect annual return data from MSCI Private Assets; real assets—private real estate represented by the NFI-ODCE Index. MSCI Private Assets data used in this research reflects returns of U.S. private capital funds and funds of funds. See Appendix for index/asset category details. Sources: Bloomberg Finance L.P., HFR Inc., www.HFR.com, © 2024 HFR, Inc. All rights reserved, Morningstar, MSCI Private Assets, Societe Generale, NCREIF, Fidelity Investments, as of Dec. 31, 2023.

Based on our analysis beginning in 2005, the returns of private equity (as represented by equity-generalist, buyout, and venture capital), were superior to all other traditional and alternative investment categories over the period studied. Importantly, private equity outperformed US small and large cap equities, illustrating the return premiums that investors expect when they sacrifice liquidity by owning private versus public equities.

An opportunity to manage risk

To explore the potential risk management benefits of alternative asset classes, we examined performance in years when public equity returns were poor. We found that during these years of poor U.S. equity returns, all of the traditional asset classes experienced negative returns. Among the alternatives categories, we found that managed futures experienced the best returns overall, at 6.9%. Private real estate, direct lending, and macro also generated positive returns.
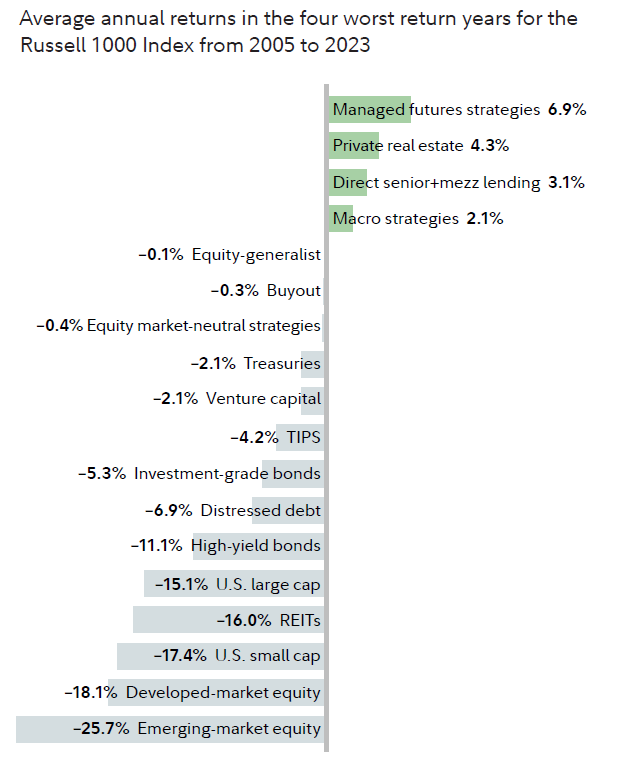
Chart shows the average annual returns in the four worst return years for the Russell 1000 index from 2005 to 2023. Managed futures strategies had the best performance, at 6.9%.
Past performance is no guarantee of future results. Average annual returns in the bottom four return years for the Russell 1000 Index from 2005 to 2023. Traditional asset categories: U.S. large cap equity—Russell 1000 Index; U.S. small cap equity—Russell 2000 Index; developed-market equity—MSCI EAFE Index; emerging-market equity—MSCI Emerging-Market Index; Treasuries—Bloomberg U.S. Long Treasury Index; Treasury inflation-protected securities—Bloomberg U.S. Treasury Inflation Linked Bond Index; investment grade bonds—Bloomberg U.S. Credit Index; high-yield bonds—ICE BofA U.S. High Yield Index; REITs—FTSE NAREIT All Equity REIT Index. Alternative categories: Liquid alternatives—HFRI Macro Total Index and HFRI EH Equity Market Neutral Index; Managed futures: SG CTA Index (note, there may be managed futures strategies in both the HFR and SG indexes); private equity—equity generalist, buyout, and venture capital reflect annual return data from MSCI Private Assets; private credit—direct senior+mezz lending, and distressed debt reflect annual return data from MSCI Private Assets; real assets—private real estate represented by the NFI-ODCE Index. MSCI Private Assets data used in this research reflects returns of U.S. private capital funds and funds of funds. See Appendix for index/asset category definitions. Sources: Bloomberg Finance L.P., HFR Inc., www.HFR.com, © 2024 HFR, Inc. All rights reserved, Morningstar, MSCI Private Assets, Societe Generale, NCREIF, Fidelity Investments, as of Dec. 31, 2023.

A means of improving diversification

To understand the diversification benefits of alternatives within a portfolio context, we analyzed the average historical correlations of each category with the other 17 asset classes from 2005 through 2023. Among the alternatives we studied, managed futures exhibited negative correlation with other asset categories, while macro, private real estate, and venture capital also exhibited diversifying characteristics in a multi-asset class portfolio context.
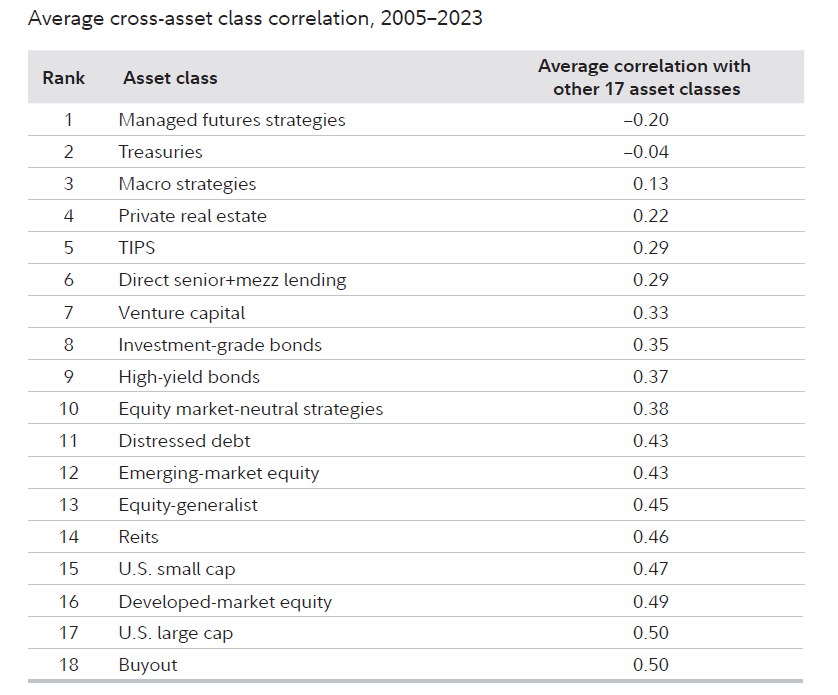
Chart shows the average cross-asset class correlation for 16 different asset classes between 2005-2023. Managed futures strategies had the lowest average correlation with the other asset classes at -0.20.
Past performance is no guarantee of future results. Average correlations with the other 17 asset classes. Traditional asset categories: U.S. large cap equity—Russell 1000 Index; U.S. small cap equity—Russell 2000 Index; developed-market equity—MSCI EAFE Index; emerging-market equity—MSCI Emerging-Market Index; Treasuries—Bloomberg U.S. Long Treasury Index; Treasury inflation-protected securities—Bloomberg U.S. Treasury Inflation Linked Bond Index; investment-grade bonds—Bloomberg U.S. Credit Index; high-yield bonds—ICE BofA U.S. High Yield Index; REITs—FTSE NAREIT All Equity REIT Index. Alternative categories: liquid alternatives—HFRI Macro Total Index and HFRI EH Equity Market Neutral Index; managed futures: SG CTA Index (note, there may be managed futures strategies in both the HFR and SG indexes); private equity—equity-generalist, buyout, and venture capital reflect annual return data from MSCI Private Assets; private credit—direct senior+mezz lending, and distressed debt reflect annual return data from MSCI Private Assets; real assets—private real estate represented by the NFI-ODCE Index. MSCI Private Assets data used in this research reflects returns of U.S. private capital funds and funds of funds. See Appendix for underlying index details. See Appendix for index/asset category definitions. Sources: Bloomberg Finance L.P., HFR Inc., www.HFR.com, © 2024 HFR, Inc. All rights reserved, Morningstar, MSCI Private Assets, Societe Generale, NCREIF, Fidelity Investments, as of Dec. 31, 2023.

Consider your needs as an investor

Based on the potential risk, return, and diversification benefits of the alternative asset categories we've outlined, investors may improve investment outcomes by incorporating them into multi-asset class portfolios. The types of alternative investment strategies and vehicle structures an investor might consider will depend on their investment objective, time horizon, and risk tolerance. Furthermore, some categories of alternatives have a wide dispersion of returns among managers and strategies, so the performance an investor experiences in a single strategy may differ from the data shown in the examples shown here. The broad range of investment outcomes of some alternative strategies suggests that investors who choose to allocate to alternative investments may want to consider diversified exposure to alternatives, such as a fund of funds, multi-strategy solution, or in the case of real estate, a real estate investment trust (REIT).

How Fidelity Private Wealth Management® clients can qualify for our alternative investments program

Because alternative investments come with unique sets of risks, the requirements governing who can participate in this program are different than those of traditional investments. While your Fidelity advisor can help you better understand these requirements, which often vary from offering to offering, participation in the program is generally only available to qualified purchasers enrolled in Fidelity Private Wealth Management.

Explore alternative investments

Expand beyond stocks, bonds, and cash.

More to explore

1. Fidelity Investments, “A Study of Allocations to Alternative Investments by Institutions and Financial Advisors,” April 2023 2. We would also note that to analyze the returns of traditional asset classes, we use publicly available indices, which aggregate the returns of, for instance, stocks and bonds, and are not directly investable or inclusive of fees. We utilized net-of-fee returns for the nine alternative strategies, so the returns of these categories may be understated relative to the traditional asset classes in our study. But we conducted analysis to account for typical fees for the traditional asset class categories, and the results presented here did not change materially. While fees for alternatives are generally higher than most traditional asset classes, they may be offset by leverage. Of note, the direct lending index does not reflect leverage and is gross of fees because it captures the returns of the underlying loans in the index. Therefore, for this asset class, we utilized modeling to calculate a performance return that reflects leverage and net of fees. Our analysis begins in 2005 because that is the earliest we could obtain high-quality data for direct lending—the largest category of private credit. However, we conducted analysis on the other asset categories back to 2001 to assess the impact of the bursting of the Internet bubble. 3. Methodology details: Traditional asset categories: U.S. large cap equity—Russell 1000 Index; U.S. small cap equity—Russell 2000 Index; developed-market equity—MSCI EAFE Index; emerging-market equity—MSCI Emerging-Market Index; Treasuries—Bloomberg US Long Treasury Index; Treasury inflation-protected securities—Bloomberg US Treasury Inflation Linked Bond Index; investment-grade bonds—Bloomberg US Credit Index; high-yield credit—ICE BofA US High Yield Index; REITs—FTSE NAREIT All Equity REITs Index. Alternative categories: liquid alternatives—HFRI Macro Total Index and HFRI EH Equity Market Neutral Index; managed futures: SG CTA Index (note, there may be managed futures strategies in both the HFR and SG indexes); private equity—equity-generalist, buyout, and venture capital reflect annual return data from Burgiss; private credit—direct lending represented by the Cliffwater Direct Lending Index; distressed debt reflects annual return data from Burgiss; real assets—private real estate represented by the NFI-ODCE Index. Burgiss calculation details: Results are posted with every quarter-end publication date. The results reflect those of U.S. private capital funds and funds of funds and are net of fees and carried interest. Vintage is assigned based on the year of initial cash flow date. Pooled results are calculated based on the composite transaction (cash flow and valuation) activity of the underlying funds. Roll-forward valuations are used to calculate results whenever reported valuations are not available. We started our analysis in 2005, which represented the longest period for these 18 asset classes. Our analysis began in 2005 because that is the earliest we could obtain high-quality data for direct lending—the largest category of private credit. Longer or different time periods could result in different outcomes. We used three indexes to represent liquid alternatives in the research because they have longer track records dating back to 2005, the beginning of the time period in our analysis, and the indexes represent strategies that are often offered in liquid structures. But we would note that liquid alternatives strategies represent a diverse range of investment strategies that would be much wider in scope. We would also note that the HFR and SG index constituent strategies offer a spectrum of liquidity and may include some strategies with lockups or other illiquidity features. Given that the Cliffwater Direct Lending Index reflects unlevered, gross of fees performance, we made the following modeling adjustments so the returns would align with the other seven alternative asset classes shown in this research in regard to how most investors can likely access each asset class. First, we assumed a hypothetical leverage (debt-to-equity ratio) of 100%, along with an assumed leverage cost of 2.5% over the Secured Overnight Funding Rate (SOFR); and next we subtracted estimated fees of 2.7%, which reflect management, performance and direct-lending fees typically charged to investors. These estimations are based on Fidelity internal research, academic literature review, and communication with fund managers. Of note, both the mean return and volatility measures increase after these adjustments. Bloomberg U.S. Credit Index is a market value-weighted index of investment-grade corporate fixed-rate debt issues with maturities of one year or more. Bloomberg U.S. Long Treasury Index measures the performance of U.S. dollar-denominated, fixed-rate, nominal debt issued by the U.S. Treasury with a maturity greater than 10 years. Bloomberg U.S. Treasury Inflation-Protected Securities (TIPS) Index (Series-L) is a market value-weighted index that measures the performance of inflation-protected securities issued by the U.S. Treasury. ICE BofA U.S. High Yield Index is a market capitalization-weighted index of U.S. dollar-denominated, below-investment-grade corporate debt publicly issued in the U.S. market. The FTSE NAREIT All Equity REITs Index is a free-float-adjusted, market capitalization-weighted index of U.S. equity REITs. Constituents of the index include all tax-qualified REITs with more than 50% of total assets in qualifying real estate assets other than mortgages secured by real property. HFRI Macro Total Index: Investment managers who trade a broad range of strategies in which the investment process is predicated on movements in underlying economic variables and the impact these have on equity, fixed income, hard currency, and commodity markets. Managers employ a variety of techniques, both discretionary and systematic analysis, combinations of top-down and bottom-up theses, quantitative and fundamental approaches, and long and short-term holding periods. Although some strategies employ relative value techniques, macro strategies are distinct from relative value strategies in that the primary investment thesis is predicated on predicted or future movements in the underlying instruments, rather than realization of a valuation discrepancy between securities. In a similar way, while both macro and equity hedge managers may hold equity securities, the overriding investment thesis is predicated on the impact movements in underlying macroeconomic variables may have on security prices, as opposed to equity hedge, in which the fundamental characteristics on the company are the most significant are integral to investment thesis. In order to be considered for inclusion in the HFRI Monthly Indices, a hedge fund manager must submit a complete set of information to the HFR Database. Additionally, all HFRI constituents are required to report in U.S. dollars monthly, net of all fees, performance and assets under management. Constituent funds must have either $50 million assets under management or at least $10 million USD assets under management on the last reported month prior to the index rebalance and have been actively trading for at least 12 months. HFRI EH Equity Market Neutral Index: Equity market neutral strategies employ sophisticated quantitative techniques of analyzing price data to ascertain information about future price movement and relationships between select securities for purchase and sale. These can include both factor-based and statistical arbitrage/trading strategies. Factor-based investment strategies include strategies in which the investment thesis is predicated on the systematic analysis of common relationships between securities. In many but not all cases, portfolios are constructed to be neutral to one or multiple variables, such as broader equity markets in dollar or beta terms, and leverage is frequently employed to enhance the return profile of the positions identified. Statistical arbitrage/trading strategies consist of strategies in which the investment thesis is predicated on exploiting pricing anomalies that may occur as a function of expected mean reversion inherent in security prices; high frequency techniques may be employed and trading strategies may also be employed on the basis on technical analysis or opportunistically to exploit new information the investment manager believes has not been fully, completely, or accurately discounted into current security prices. Equity market neutral strategies typically maintain characteristic net equity market exposure no greater than 10% long or short. The MSCI Europe, Australasia, Far East Index (EAFE) is a market capitalization-weighted index designed to measure the investable equity market performance for global investors in developed markets, excluding the United States and Canada. MSCI Emerging-Markets (EM) Index is a market capitalization-weighted index designed to measure the investable equity market performance for global investors in emerging markets. The Russell 1000 Index is a market capitalization-weighted index designed to measure the performance of the large cap segment of the U.S. equity market. The Russell 2000 Index is a market capitalization-weighted index designed to measure the performance of the small cap segment of the U.S. equity market. It includes approximately 2,000 of the smallest securities in the Russell 3000 Index. SG CTA Index is designed to track the largest 20 (by AUM) CTAs and be representative of the managed futures space. Managers must be open to new investment and report returns on a daily basis. The CTA Index is equally weighted, and rebalanced and reconstituted annually. NFI-ODCE Index (NCREIF), short for NCREIF Fund Index Open End Diversified Core Equity, is an index of investment returns reporting on both a historical and current basis the results of 38 open end commingled private real estate funds pursuing a core investment strategy, some of which have performance histories dating back to the 1970s.

Past performance is no guarantee of future results.

Diversification and asset allocation do not ensure a profit or guarantee against loss.

Indexes are unmanaged. It is not possible to invest directly in an index.

Investment decisions should be based on an individual's own goals, time horizon, and tolerance for risk. Nothing in this content should be considered to be legal or tax advice, and you are encouraged to consult your own lawyer, accountant, or other professional advisor before making any financial decision. Stock markets are volatile and can fluctuate significantly in response to company, industry, political, regulatory, market, or economic developments. Foreign markets can be more volatile than U.S. markets due to increased risks of adverse issuer, political, market, or economic developments, all of which are magnified in emerging markets. These risks are particularly significant for investments that focus on a single country or region. Alternative investment strategies may not be suitable for all investors and are not intended to be a complete investment program. Alternatives may be relatively illiquid; it may be difficult to determine the current market value of the asset; and there may be limited historical risk and return data. Costs of purchase and sale may be relatively high. A high degree of investment analysis may be required before investing. Investing in digital assets, such as bitcoin, is speculative and may involve a high degree of risk. Digital assets can become illiquid at any time and are only for those investors willing to risk losing some or all their investment and who have the experience and ability to evaluate the risks and merits of an investment in bitcoin.

Investing involves risk, including risk of loss.

The Chartered Financial Analyst (CFA®) designation is offered by the CFA Institute. To obtain the CFA charter, candidates must pass three exams demonstrating their competence, integrity, and extensive knowledge in accounting, ethical and professional standards, economics, portfolio management, and security analysis, and must also have at least 4,000 hours of qualifying work experience completed in a minimum of 36 months, among other requirements. CFA is a trademark owned by CFA Institute.

Investment advisory services provided through Fidelity Personal and Workplace Advisors LLC, a registered investment adviser, for a fee. Brokerage services provided through Fidelity Brokerage Services LLC, Member NYSE, SIPC. Both are Fidelity Investments companies.

Fidelity Brokerage Services LLC, Member NYSE, SIPC, 900 Salem Street, Smithfield, RI 02917

1035155.11.1