Using Fidelity Trader+™ Web
It’s easy to monitor your trades and market movements using Fidelity’s Trader+™ Web. Access powerful trading features and integrate all of your essential tools in one screen.
Follow our step-by-step guide to learn how to configure your Fidelity Trader+™ Web layout to make the most of its monitoring, charting, and trading capabilities.
Monitor your portfolio on one screen
1. Log in to your Fidelity brokerage account. From Accounts & Trade, select Fidelity Trader+™ Web.

2. Review your layout and get familiar with all the tools in one screen.

3. Access the Positions tool panel to easily monitor your investments and trade ideas.
- Efficiently scan your holdings for changes with real-time streaming prices.
- Speed up your research by selecting a symbol in Positions or Watchlist to simultaneously update the Chart, Quote, and News tools.
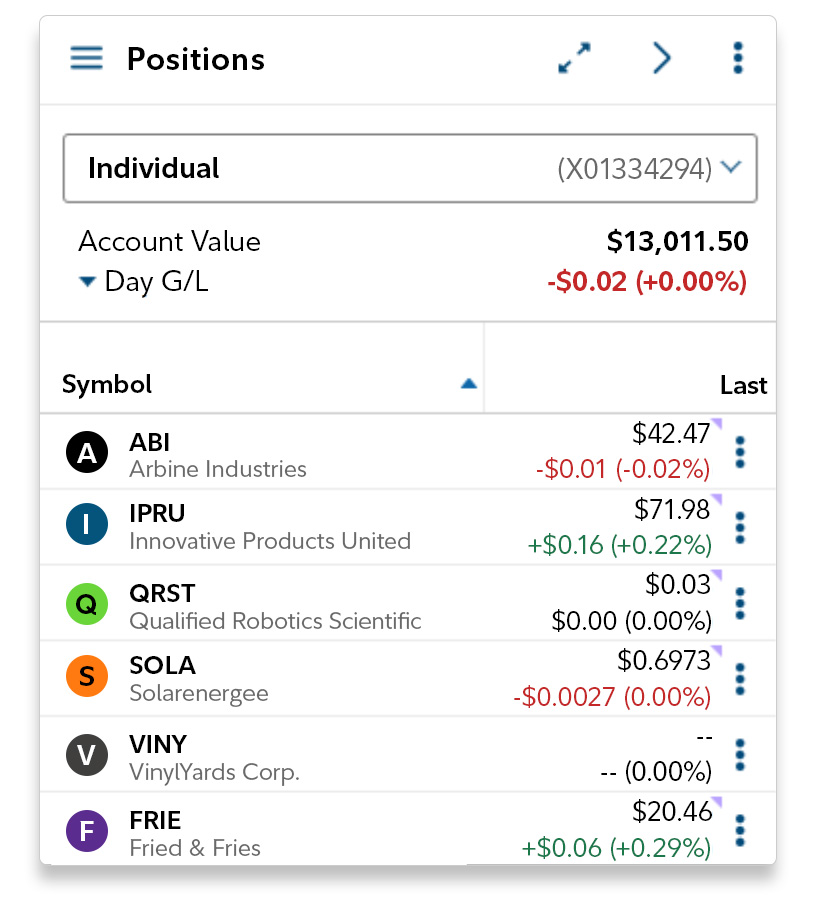
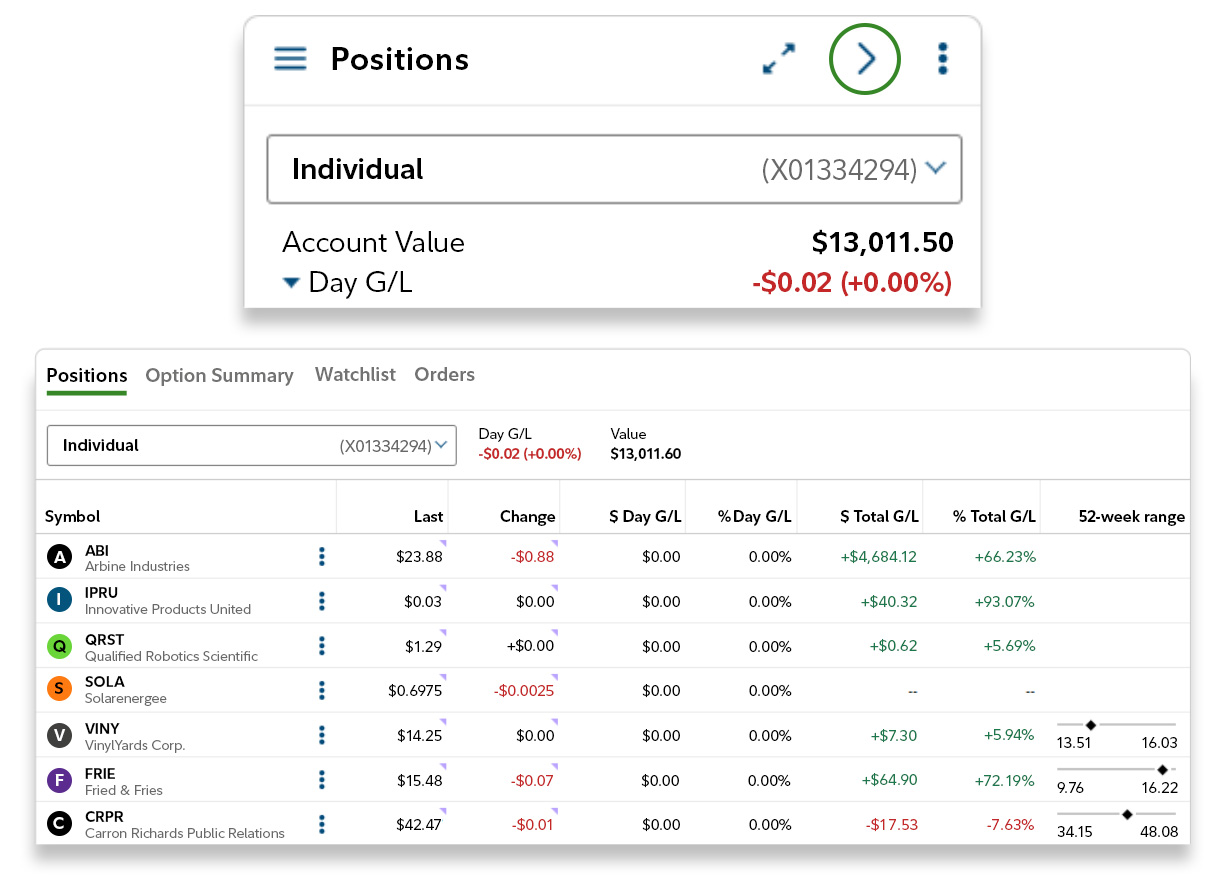
4. Select the navigational arrow to expand your Positions panel and configure your layout.
- Additional details, including real-time bid/ask quotes and the 52-week range, will be displayed for your investments.
- Easily review additional investment information by toggling through the Option Summary, Watchlist, and Orders tabs on the Positions panel.
- Resize any other tool panels to meet your trading needs.
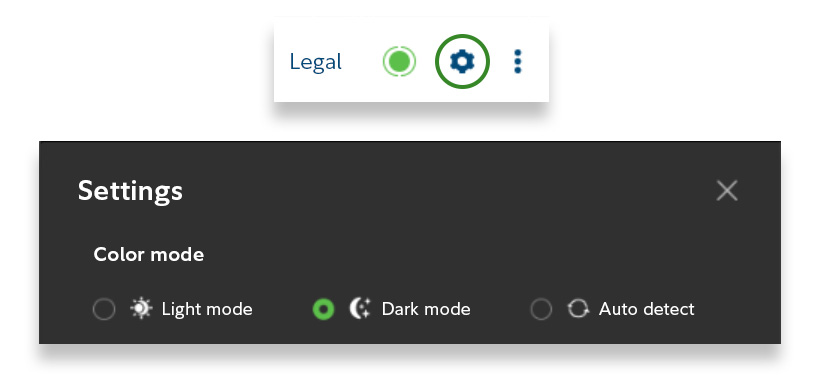
5. Select Settings to finalize your layout configuration. Enable dark mode and update other dashboard settings as needed.
Analyze markets with powerful charting
1. Analyze markets and search for trade opportunities with real-time streaming Charts.
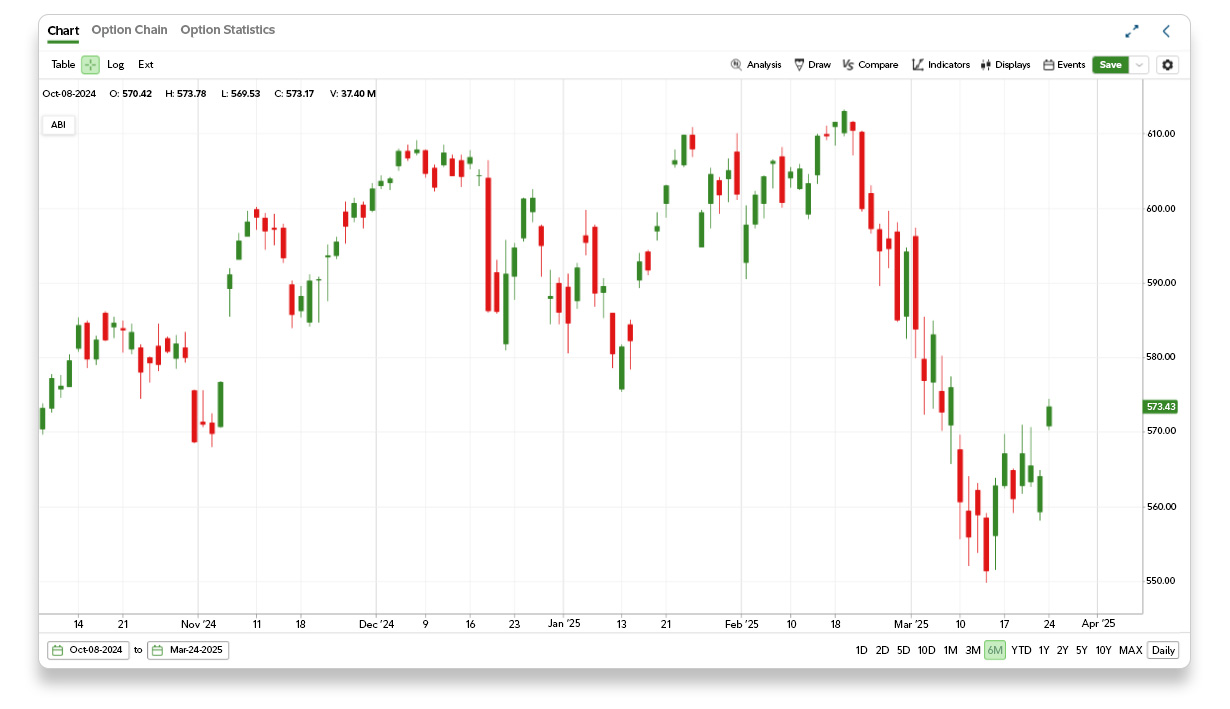
2. Adjust pricing data by scrolling with your mouse or selecting the timeframe and frequency below the chart to align with your investment time horizon.

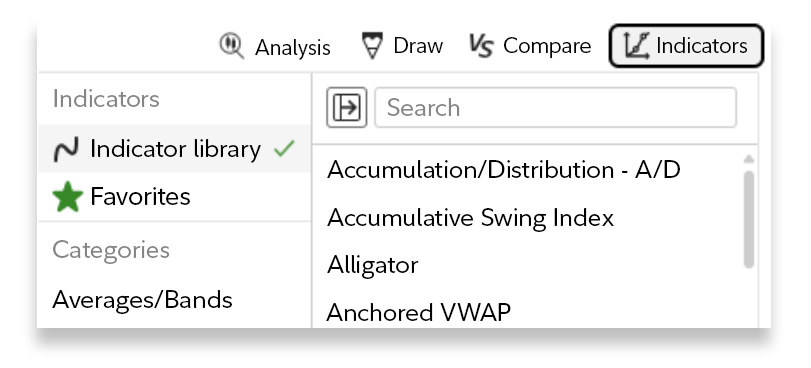
3. Add chart Indicators, which enable traders to better understand trends in price, volume, and volatility, to quickly identify trading opportunities.
- Search for indicators by name or scroll through the Indicator library.
- Save any indicator to your Favorites for future use.
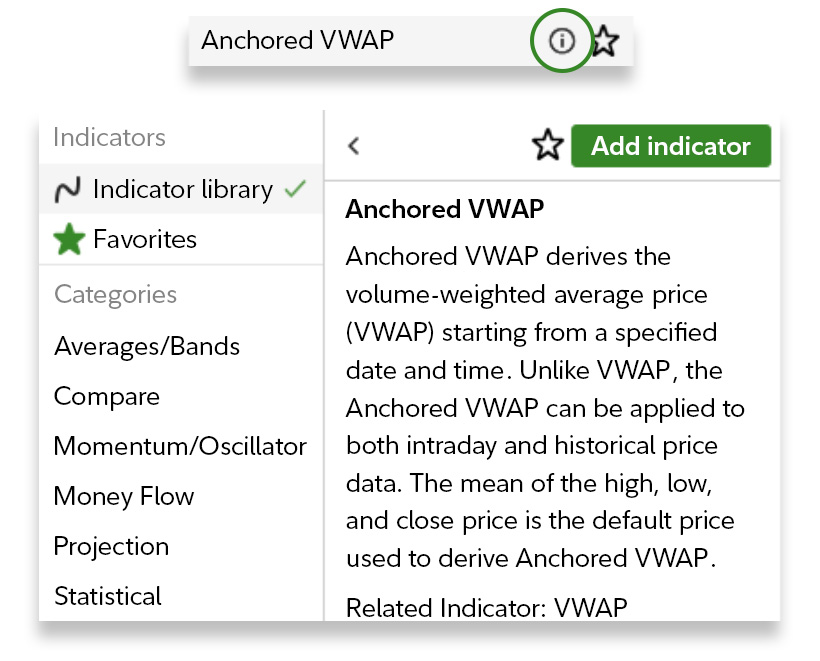
4. Select the information icon for a brief explanation of each technical indicator.
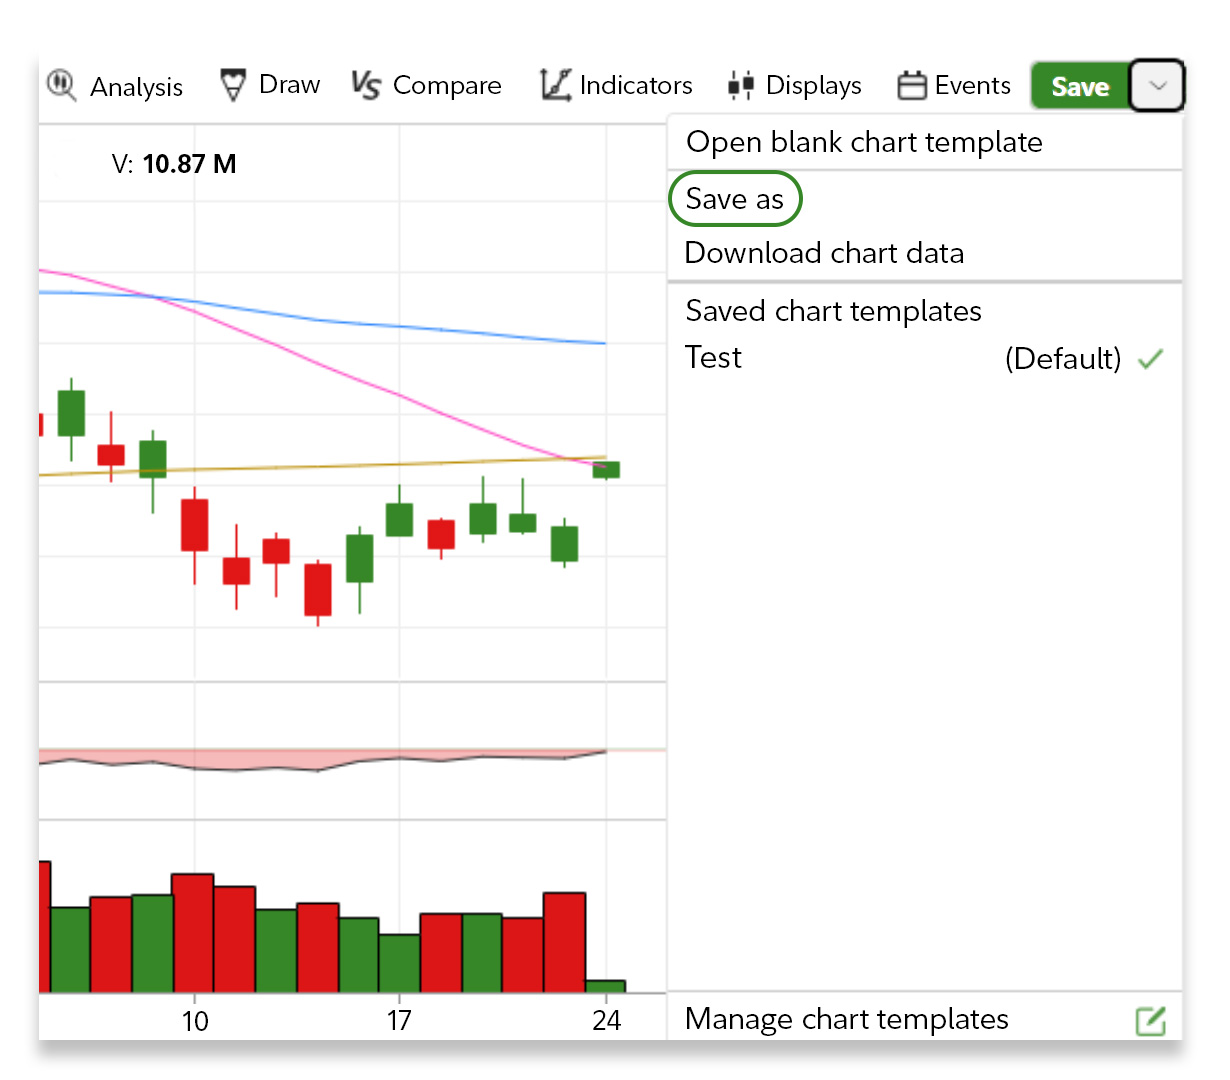
5. Save your chart to lock in your custom drawings, indicators, and settings. Access previously saved chart templates to go from chart to trade, faster.
Execute trades faster
1. Right click anywhere on the chart to initiate a trade.
- When you enter a limit or stop price, the chart displays an intuitive pricing line, allowing you to visualize your trades more effectively.
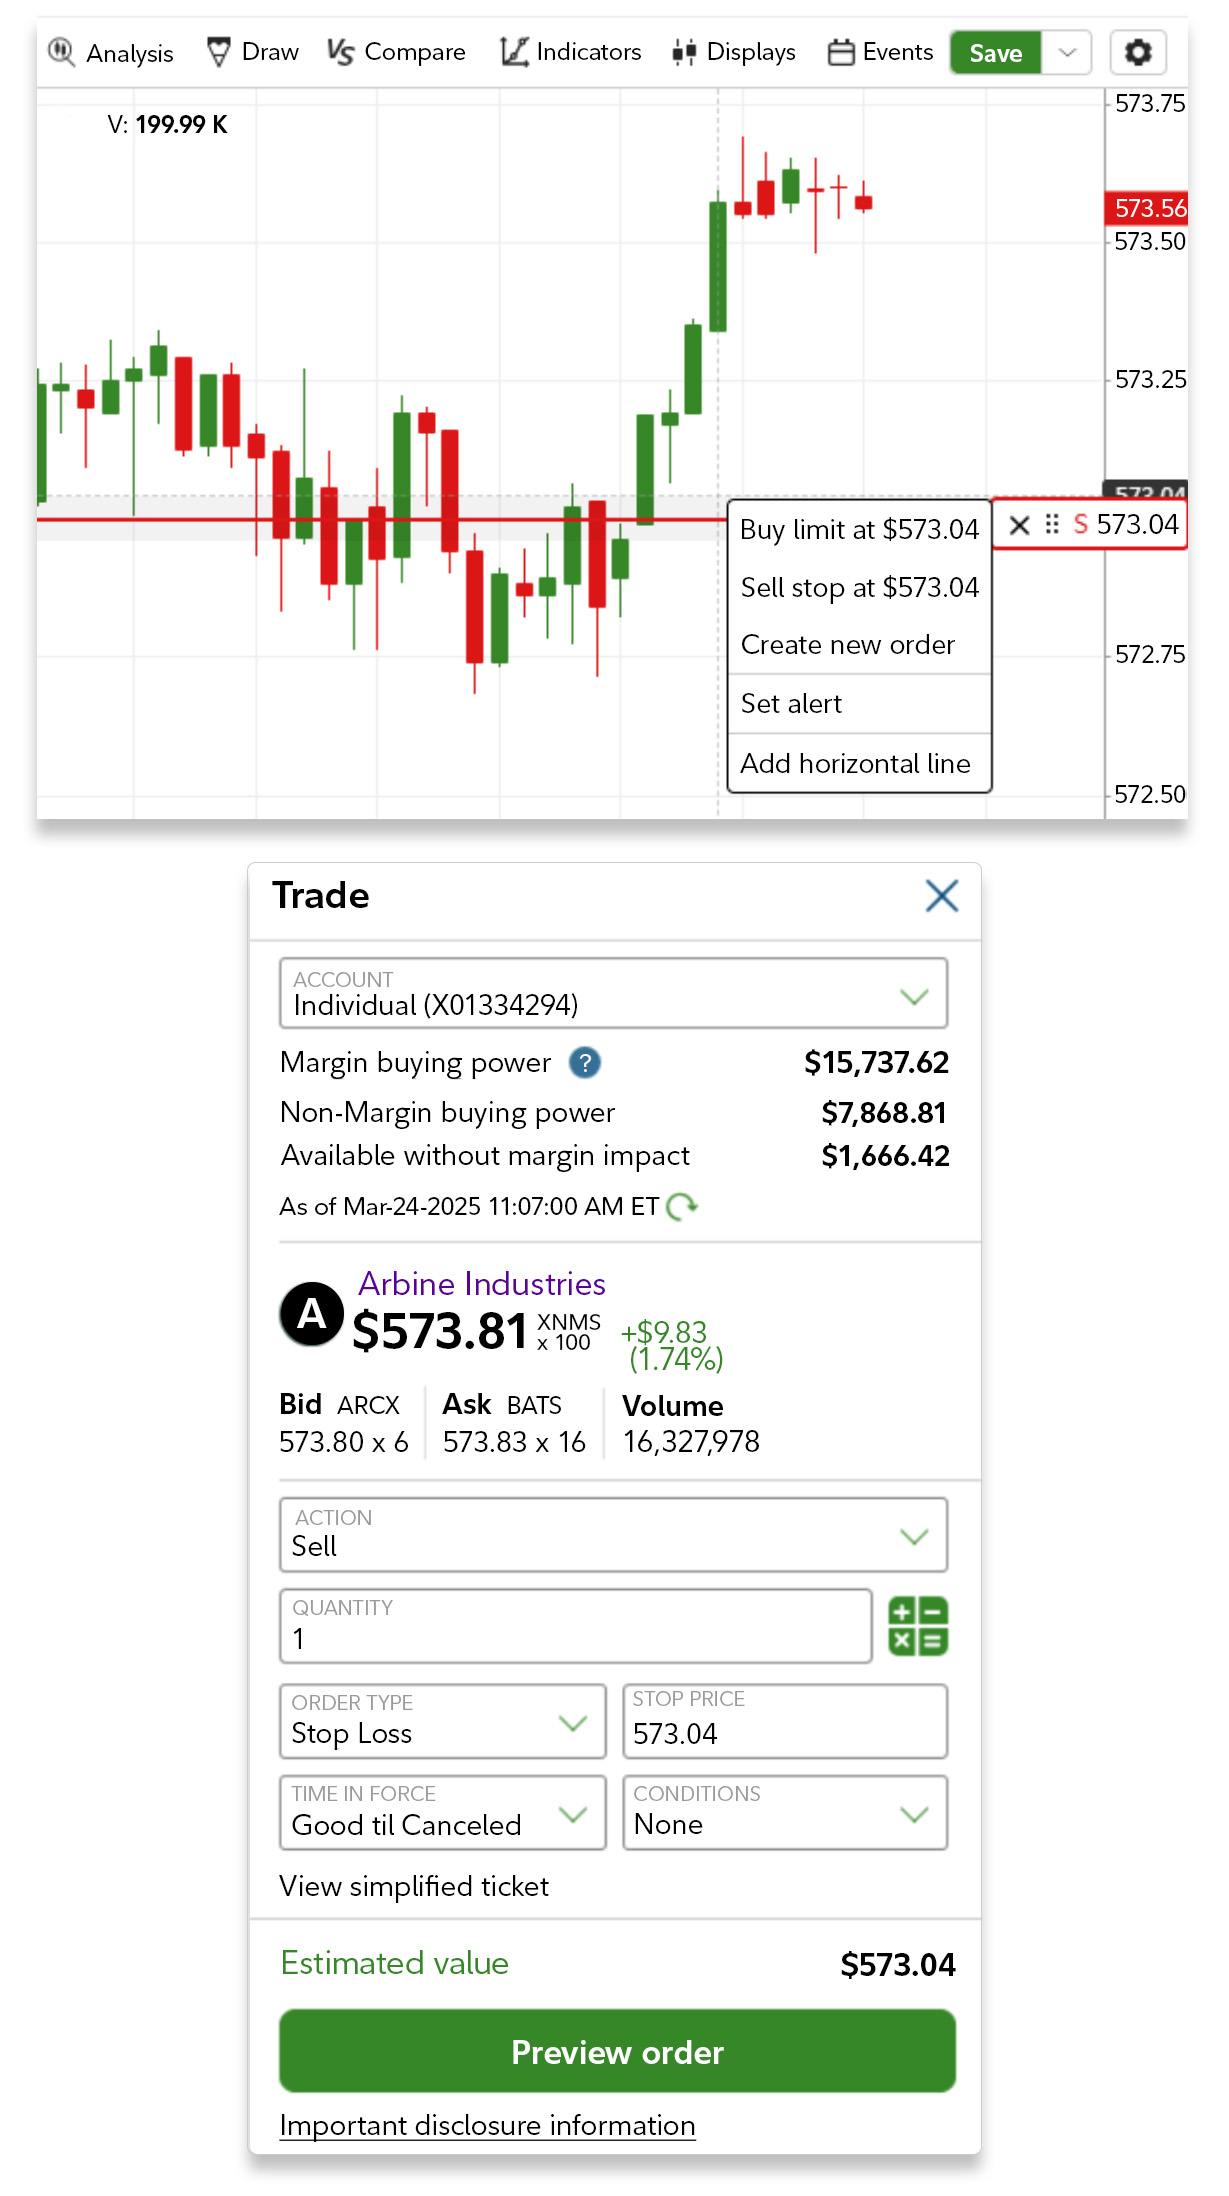
2. Preview and place your order to complete the trade.
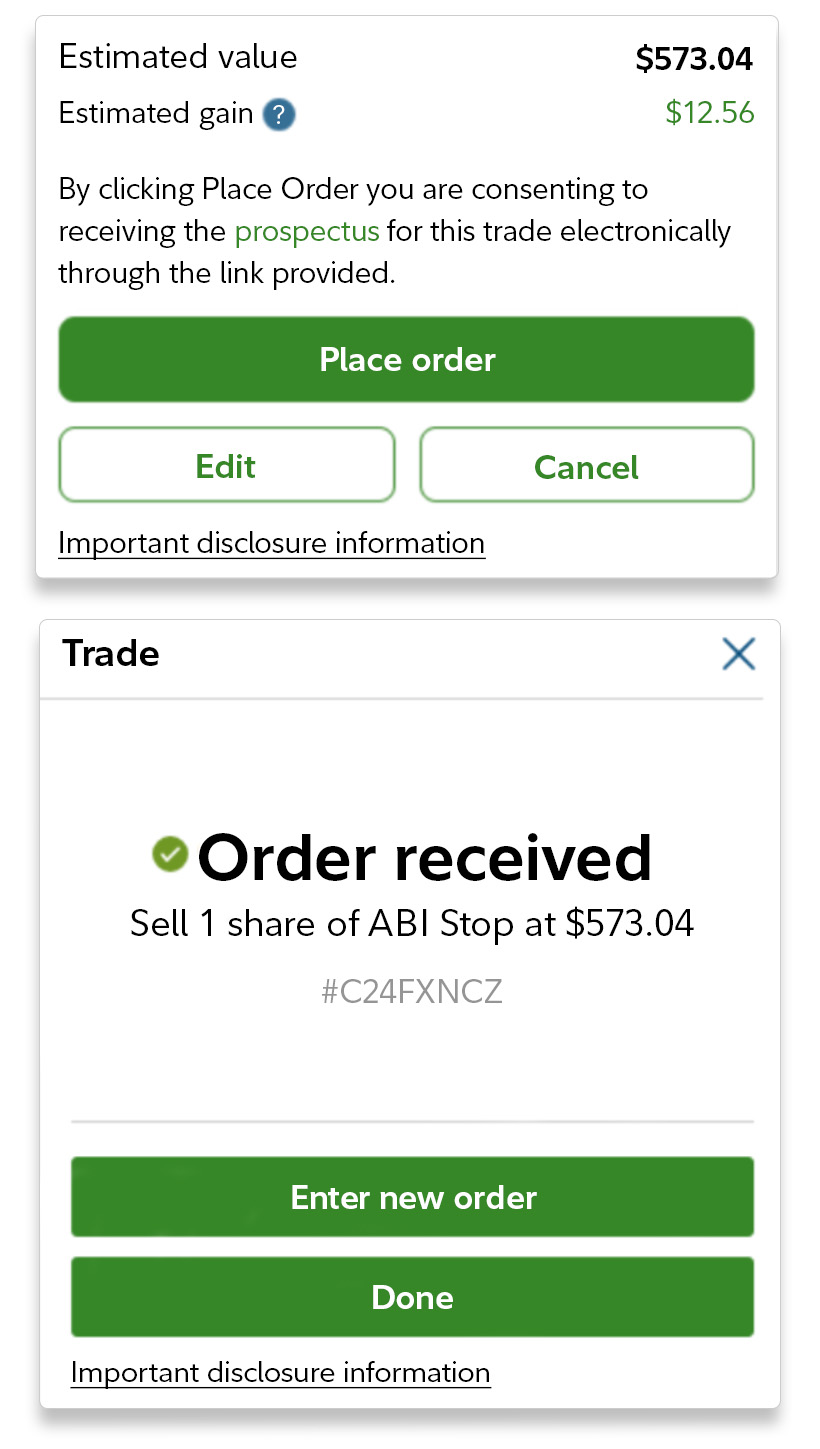
3. Review your Orders tool panel to see the status of your open, canceled, or filled orders and stay informed about your trades.
.jpg)
Congratulations—you’re ready to get started with Fidelity's Trader+™ Web trading platform.
Now you're better equipped with the tools and insights needed to confidently navigate the markets. Start your trading journey today and take control of your financial future.


