Description
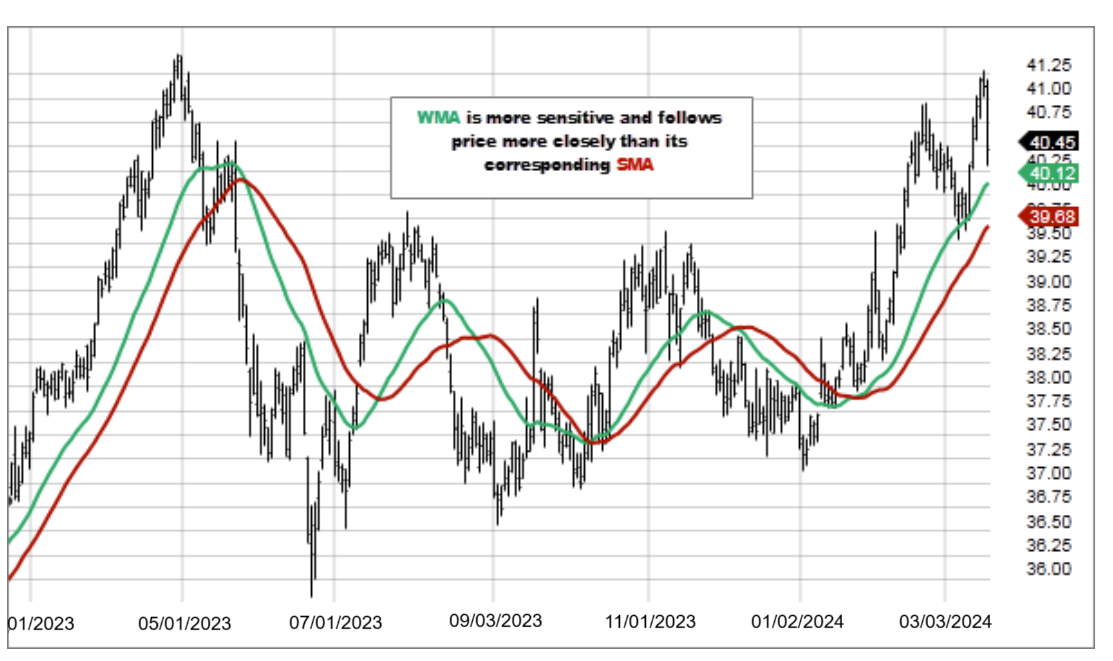
A Weighted Moving Average puts more weight on recent data and less on past data. This is done by multiplying each bar’s price by a weighting factor. Because of its unique calculation, WMA will follow prices more closely than a corresponding Simple Moving Average.

- Use the WMA to help determine trend direction. It could be an indication to buy when prices dip near or just below the WMA. It could be an indication to sell when prices rally towards or just above the WMA.
- Moving averages can also indicate support and resistance areas. A rising WMA tends to support the price action, while a falling WMA tends to provide resistance to price action. This strategy reinforces the idea of buying when price is near the rising WMA or selling when price is near the falling WMA.
- All moving averages, including the WMA, are not designed to identify a trade at the exact bottom or top. Moving averages tend to validate that your trade is in the general direction of the trend, but with a delay at entry and exit. The WMA has a shorter delay then the SMA.
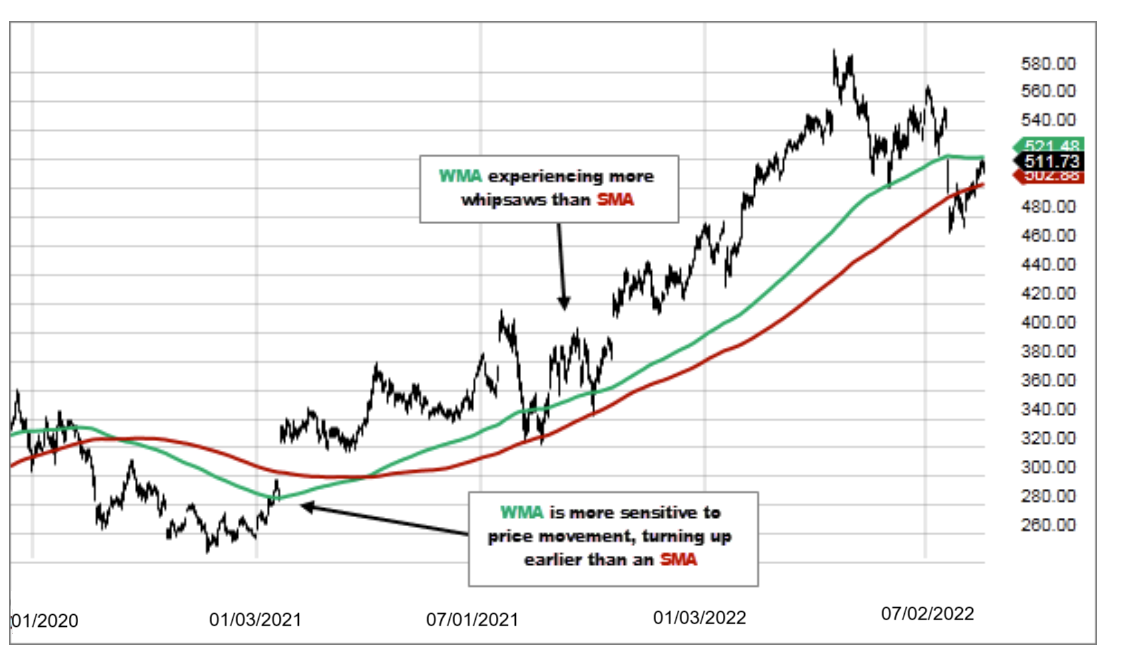
- Use the same rules that apply to SMA when interpreting WMA. Keep in mind, though, that WMA is generally more sensitive to price movement. This can be a double-edged sword. On one side, WMA can identify trends sooner than a SMA. On the flip side, the WMA will probably experience more whipsaws than a corresponding SMA.

The most recent data is more heavily weighted, and contributes more to the final WMA value.
The weighting factor used to calculate the WMA is determined by the period selected for the indicator. For example, a 5 period WMA would be calculated as follows:
WMA = (P1 * 5) + (P2 * 4) + (P3 * 3) + (P4 * 2) + (P5 * 1) / (5 + 4+ 3 + 2 + 1)
Where: P1 = current price P2 = price one bar ago, etc…
