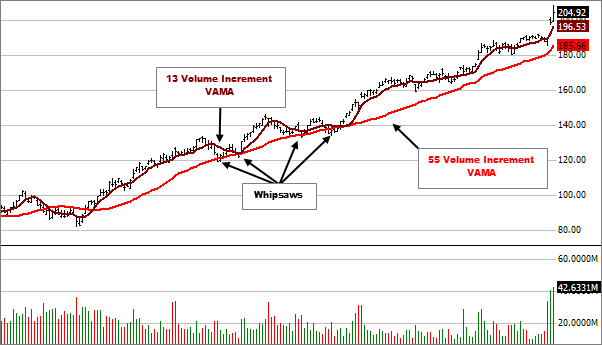
Description
Time-based moving averages make the assumption that all trading days are equal. Important trading days are usually associated with heavier volume. VAMA makes price and volume equal partners when computing the average. Higher volume trading days are more heavily weighted than lower volume days.
With time-based moving averages the period determines how many bars are used to calculate the average. With VAMA the prices are averaged within a specified period of Volume Increments and therefore the look back period will vary depending on how heavy/low the volume was on preceding bars. Because of this, new data being added to the chart can cause the moving average to change through all past data.

- Richard W. Arms Jr., the developer of this indicator, suggests using a Volume Increment of 55 to determine if the stock is strong or weak. Strong stocks tend to stay above this average and weak stocks below.

- To reduce the number of short term price / VAMA crossovers (whipsaws) a smaller Volume Increment VAMA can be plotted and used in conjunction with the larger Volume Increment. Potential trading opportunities would occur when the averages cross each other.

- Calculate the average volume using every time period in the entire price series being studied (note that this means that the exact value of the moving average will vary depending on which periods you use).
- Average Volume = Average of all Volume for the chart timeframe
- Calculate the volume increment by multiplying the average volume by 0.67.
- Volume Increment = Average Volume x 0.67
- Calculate each period's volume ratio by dividing each period's actual volume by the volume increment.
- Volume Ratio = Divide each bar's Volume by the Volume Increment
- Starting at the most recent time period and working backwards, multiply each period's price by the period's volume ratio and cumulatively sum these values until the user-specified number of volume increments is reached. Note that only a fraction of the last period's volume will likely be used.
- Price x Volume Ratio = Multiply each bar's Price by its respective Volume Ratio
- Starting with the most recent bar on the chart and working backwards, sum each bar's Price x Volume Ratio and each bar's Volume Ratio until the summation of the Volume Ratio equals the period selected for the indicator.
- VAMA = Cumulative Sum of Price x Volume Ratio / indicator period.
