
Description
Standard deviation is the statistical measure of market volatility, measuring how widely prices are dispersed from the average price. If prices trade in a narrow trading range, the standard deviation will return a low value that indicates low volatility. Conversely, if prices swing wildly up and down, then standard deviation returns a high value that indicates high volatility.
- Standard deviation rises as prices become more volatile. As price action calms, standard deviation heads lower.
- Price moves with increased standard deviation show above average strength or weakness.
- Market tops that are accompanied by increased volatility over short periods of time indicate nervous and indecisive traders. Market tops with decreasing volatility over long time frames indicate maturing bull markets.
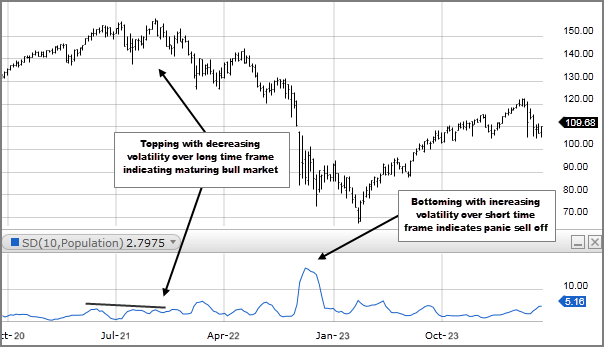
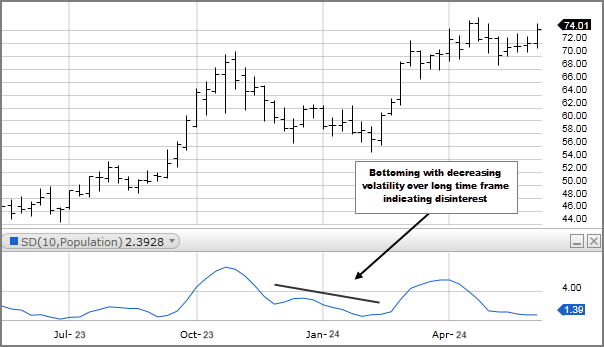
- Market bottoms that are accompanied by decreased volatility over long periods of time indicate bored and disinterested traders. Market bottoms with increasing volatility over relatively short time periods indicate panic sell-offs.
- Calculate the SMA for Period n
- Subtract the SMA value from step one from the Close for each of the past n Periods and square them
- Sum the squares of the differences and divide by n
- Calculate the square root of the result from step three
SD = Sqrt [(Sum the ((Close for each of the past n Periods – n Period SMA for current bar)^2))/ n]