
Description
Welles Wilder's Parabolic Stop and Reverse (SAR) is a trailing stop-based trading system; it is often used as an indicator as well. The SAR uses a trailing stop level that follows prices as they move up or down. The stop level increases speed based on an "Acceleration Factor." When plotted on the chart, this stop level resembles a parabolic curve, thus the indicator's name. The parabolic function accepts three parameters. The first two control the acceleration during up and down moves, respectively. The last parameter determines the maximum acceleration.
The Parabolic SAR assumes that you are trading a trend and, therefore, expects price to change over time. If you are long, the Parabolic SAR will move the stop upward every period, regardless of whether the price has moved. Parabolic SAR moves downward if you are short.
- The Parabolic SAR trading system uses the parabolic level as a “stop and reverse” point, calculating the stop for each upcoming period. When the stop is hit you close the current trade and initiate a new trade in the opposite direction. This system keeps you invested in the market at all times.
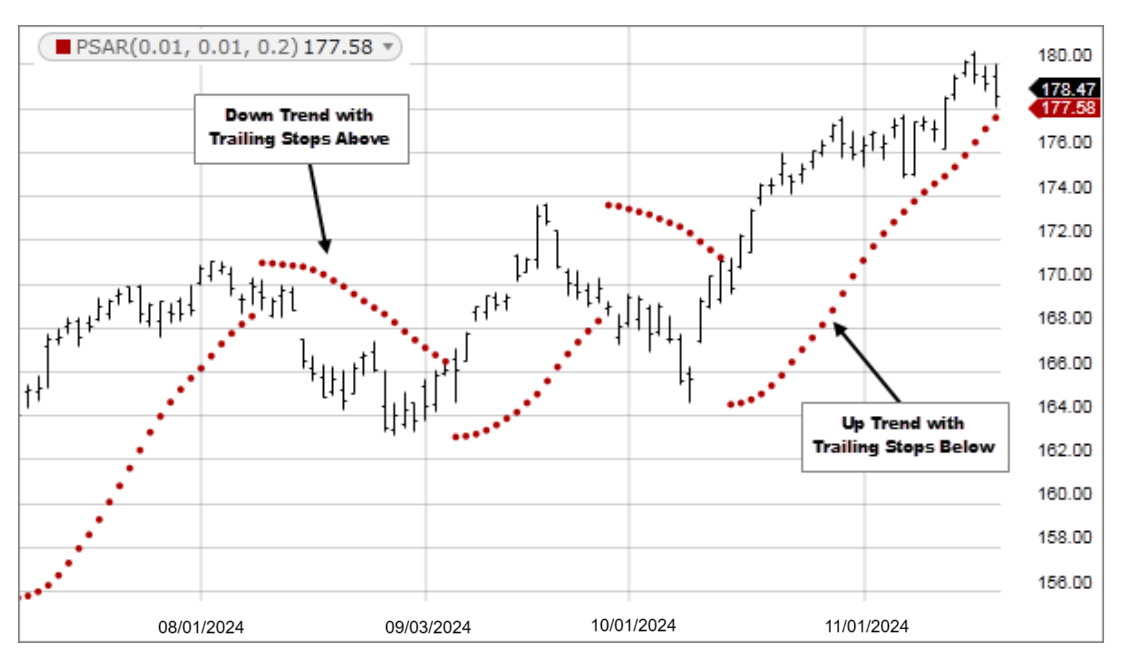
- The indicator is usually shown as a series of dots above or below the price bars. The dots are the stop levels. You should be short when the stops are above the bars; you should be long when the stops are below the bars.
- The Parabolic SAR may cause whipsaws during sideways or trendless markets.
- The Parabolic SAR excels in fast-moving trends that accelerate as they progress. The stops are also calculated to accelerate; hence you need to have the correct "Acceleration Factor" to match the market you are trading. Up and down acceleration parameters may be different.
Current SAR = Prior SAR + Acceleration Factor (Prior Extreme Point – Prior SAR)
The AF used by Wilder is 0.02. This means move the stop 2 percent of distance between EP and the original stop. Each time the EP changes, the AF increases by 0.02 up to the maximum acceleration, 0.2 in Wilders' case.
If long then EP is the highest high since going long, if short then EP is the lowest low since going short.