Description
The Percent B indicator reflects closing price as a percentage of the lower and upper Bollinger Bands®.


- If the closing price is equal to the upper Bollinger Band value, Percent B would be 100 (percent).
- If the closing price is above the upper Bollinger Band, Percent B would be greater than 100.
- If the closing price is equal to the moving average, Percent B is 50 percent.
- If the closing price is equal to the lower Bollinger Band, Percent B would be zero.
- If the closing price is below the lower band, Percent B would be negative.
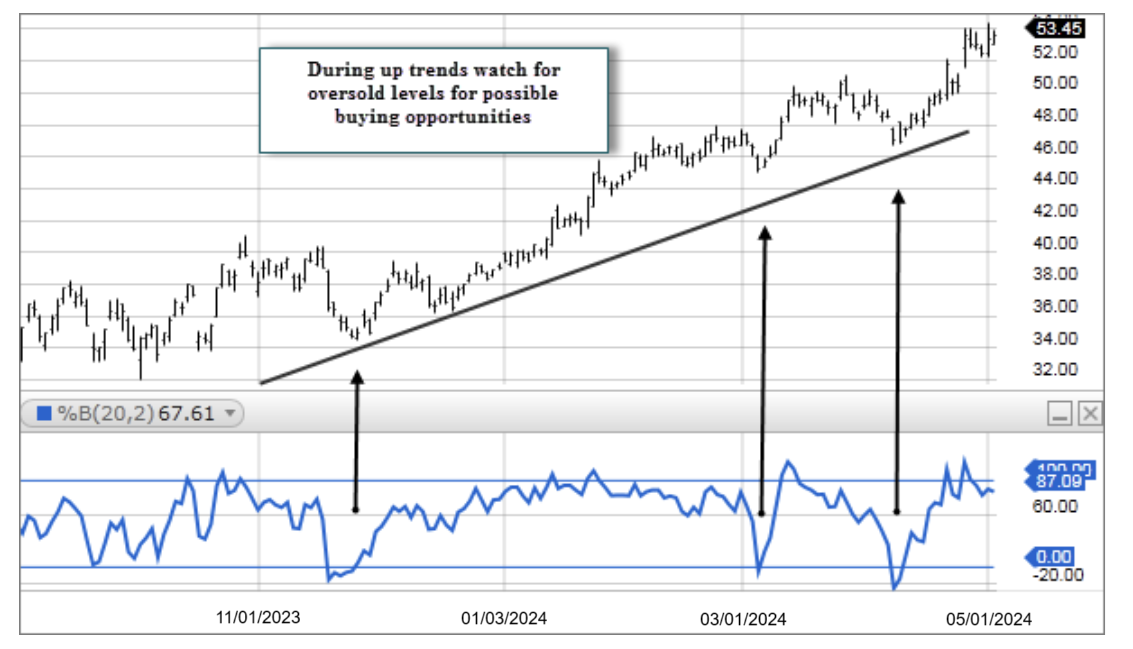
- During up trends watch for %B to reach oversold levels for possible buying opportunities.
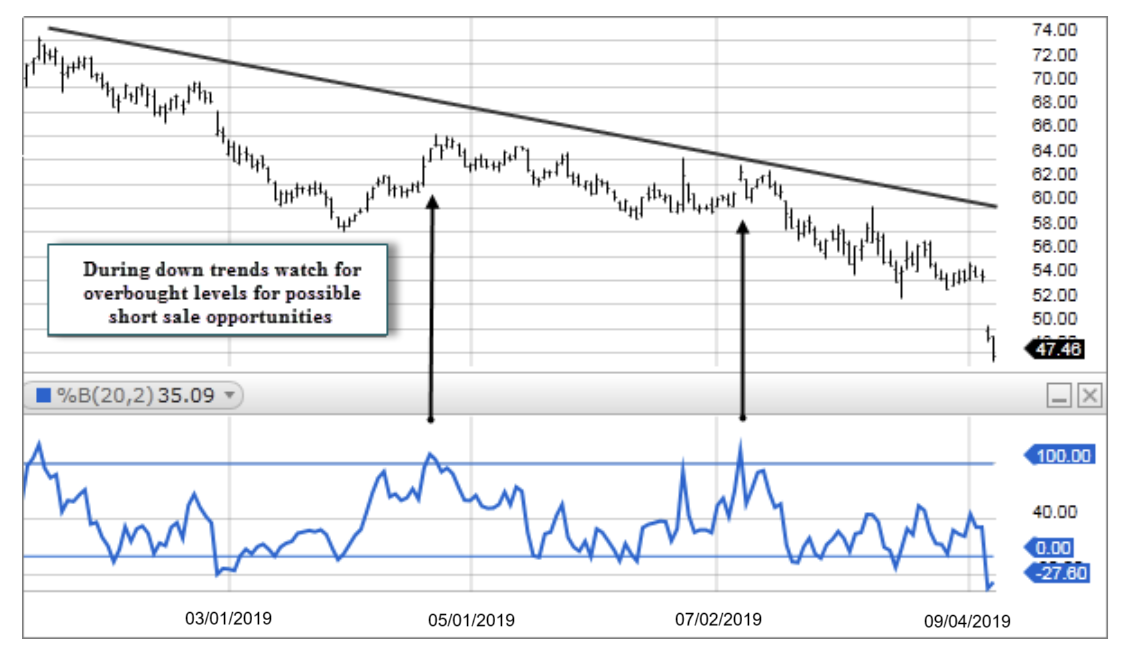
- During down trends watch for %B to reach overbought levels for possible short sale opportunities.
%B = [(Price – Lower Band) / (Upper Band – Lower Band)] * 100
