
Description
The Fibonacci retracement tool plots percentage retracement lines based upon the mathematical relationship within the Fibonacci sequence. These retracement levels provide support and resistance levels that can be used to target price objectives.
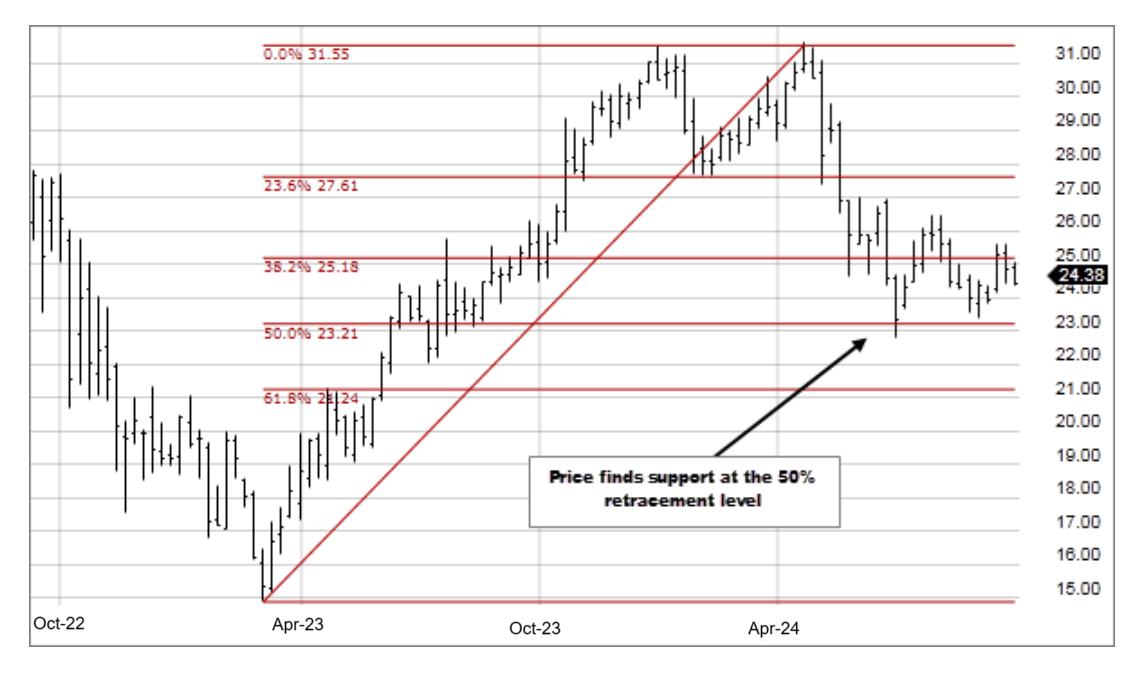
Fibonacci Retracements are displayed by first drawing a trend line between two extreme points. A series of six horizontal lines are drawn intersecting the trend line at the Fibonacci levels of 0.0%, 23.6%, 38.2%, 50%, 61.8%, and 100%.
How this indicator works
- The percentage retracements identify possible support or resistance areas, 23.6%, 38.2%, 50%, 61.8%, 100%. Applying these percentages to the difference between the high and low price for the period selected creates a set of price objectives.
- Depending on the direction of the market, up or down, prices will often retrace a significant portion of the previous trend before resuming the move in the original direction.
- These countertrend moves tend to fall into certain parameters, which are often the Fibonacci Retracement levels.
Calculation
Fibonacci numbers are a sequence of numbers in which each successive number is the sum of the two previous numbers:
1, 1, 2, 3, 5, 8, 13, 21, 34, 55, 89, 144, 233, and so on.