
Description
The Stochastic Oscillator is a momentum indicator that shows the location of the close relative to the high-low range over a set number of periods. The indicator can range from 0 to 100.
The closing price tends to close near the high in an uptrend and near the low in a downtrend. If the closing price then slips away from the high or the low, then momentum is slowing. Stochastics are most effective in broad trading ranges or slow moving trends. Two lines are graphed, the fast oscillating %K and a moving average of %K, commonly referred to as %D.
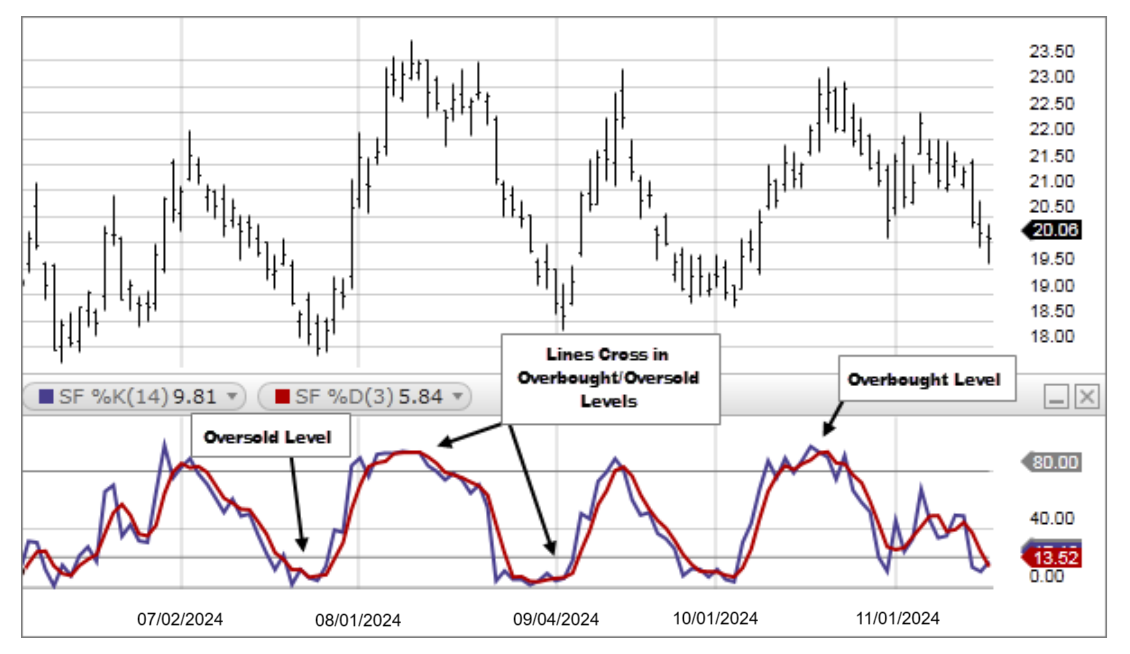
- Generally, the area above 80 indicates an overbought region, while the area below 20 is considered an oversold region. A sell signal is given when the oscillator is above the 80 level and then crosses back below 80. Conversely, a buy signal is given when the oscillator is below 20 and then crosses back above 20. 80 and 20 are the most common levels used but can be adjusted as needed.
- A crossover signal occurs when the two lines cross in the overbought or oversold region. A sell signal occurs when a decreasing %K line crosses below the %D line in the overbought region. Conversely, a buy signal occurs when an increasing %K line crosses above the %D line in the oversold region.
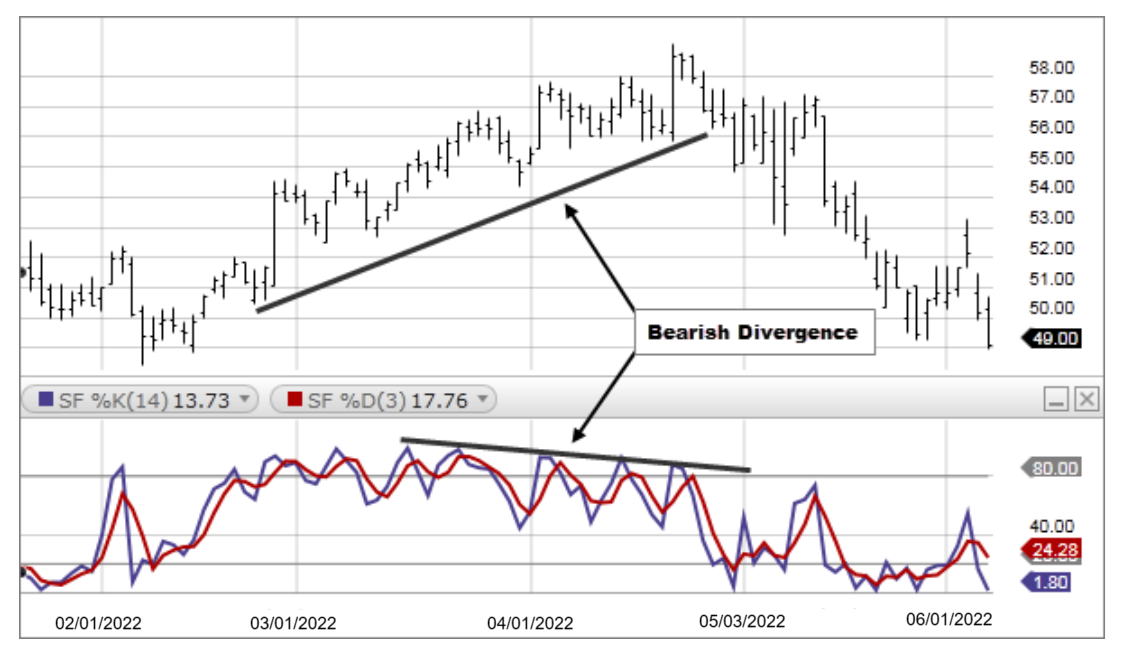
- Divergences form when a new high or low in price is not confirmed by the Stochastic Oscillator. A bullish divergence forms when price make a lower low, but the Stochastic Oscillator forms a higher low. This indicates less downward momentum that could foreshadow a bullish reversal. A bearish divergence forms when price makes a higher high, but the Stochastic Oscillator forms a lower high. This shows less upward momentum that could foreshadow a bearish reversal.
%K= 100[(C - L14) / H14 – L14)] Where: C = Latest Close L14 = Lowest low for the last 14 periods. H14 = Highest high for the same 14 periods
%D = simple moving average of %K (3 period simple moving average is the most common)