
Description
The Absolute Price Oscillator displays the difference between two exponential moving averages of a security's price and is expressed as an absolute value.
How this indicator works
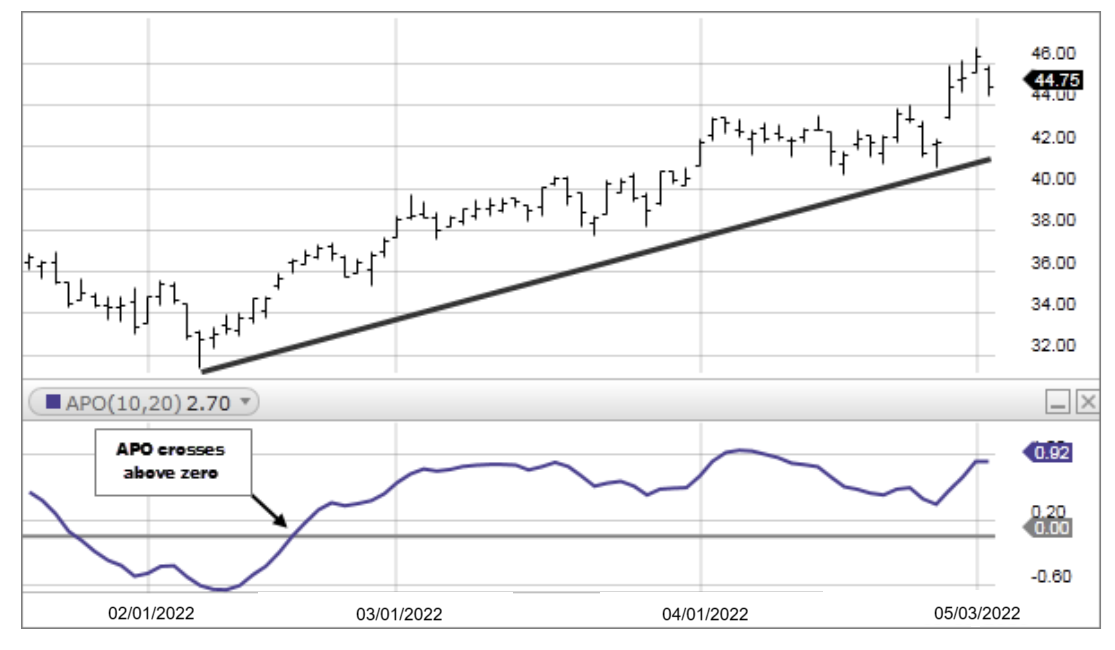
- APO crossing above zero is considered bullish, while crossing below zero is bearish.
- A positive indicator value indicates an upward movement, while negative readings signal a downward trend.
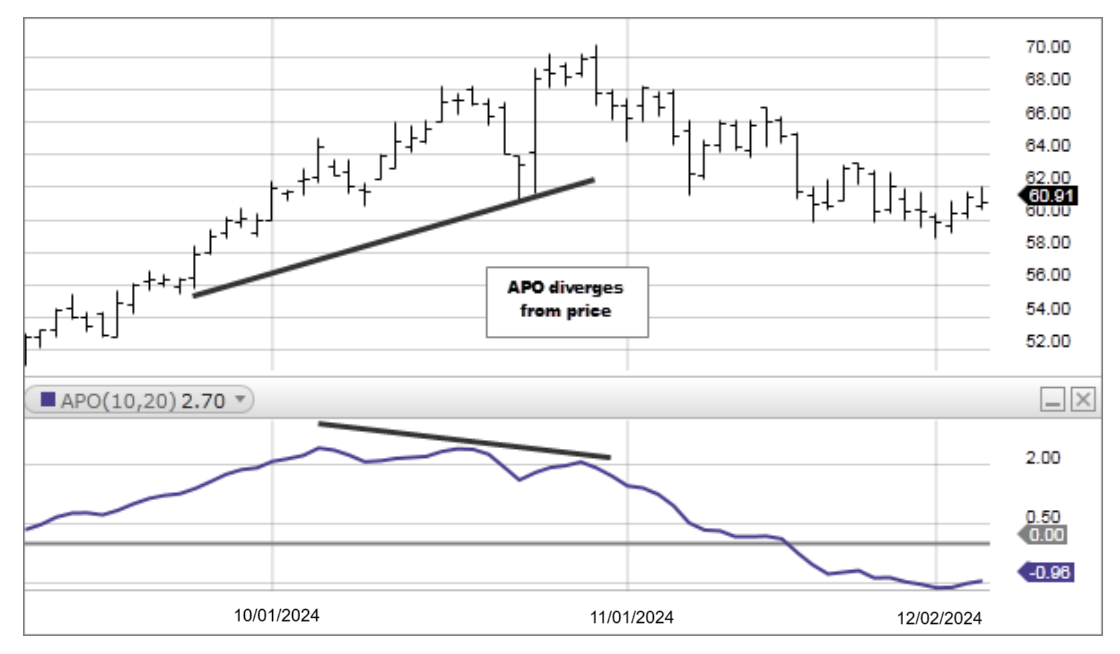
- Divergences form when a new high or low in price is not confirmed by the Absolute Price Oscillator (APO). A bullish divergence forms when price make a lower low, but the APO forms a higher low. This indicates less downward momentum that could foreshadow a bullish reversal. A bearish divergence forms when price makes a higher high, but the APO forms a lower high. This shows less upward momentum that could foreshadow a bearish reversal.
Calculation
APO = Shorter Period EMA – Longer Period EMA