Valuation is the financial process of determining what a company is worth. Valuation ratios put that insight into the context of a company’s share price, where they serve as useful tools for evaluating investment potential. Here is a list of principle valuation ratios.
Price-to-earnings
Price-to-earnings ratio (P/E) looks at the relationship between a company's stock price and its earnings. The P/E ratio gives investors an idea of what the market is willing to pay for the company's earnings. The ratio is determined by dividing a company's current share price by its earnings per share. For example, if a company is currently trading at $25 a share and its earnings over the last 12 months are $1.35 per share, the P/E ratio for the stock would be 18.5 ($25/$1.35). As the P/E goes up, it shows that current investor sentiment is favorable. A dropping P/E is an indication that the company is out of favor with investors.
Price-to-book value
Price-to-book value (P/B) is a measurement that looks at the value the market places on the book value of the company. It is calculated by taking the current price per share and dividing by the book value per share. The book value of a company is the difference between the balance sheet assets and balance sheet liabilities. It is an estimation of the value of the company if it were to be liquidated. For example, a company with a share price of $60 and a book value of $65 per share would have a P/B ratio of 0.9. A ratio over 1 generally implies that the market is willing to pay more than the equity per share, while a ratio under 1 implies that the market is willing to pay less.
Price-to-sales
The price-to-sales ratio (P/S) shows how much the market values every dollar of the company's sales. To calculate it, take the company's market capitalization and divide it by the company's total sales over the past 12 months. A company's market cap is the number of shares issued multiplied by the share price. The P/S ratio can be used in place of the P/E ratio in situations where the company has a net loss. One of the advantages of using the P/S ratio is that sales are much harder to manipulate than earnings. Since a company's sales are generally more stable than its earnings level, any large changes in the P/S ratio are often more likely to indicate a departure from the intrinsic value of the company (either up or down).
Price-to-cash flow
Price-to-cash flow ratio (P/CF) evaluates the price of a company's stock relative to how much cash flow the company generates. It is calculated by dividing the company's market cap by its operating cash flow in the most recent 12 months. It can also be calculated by dividing the per-share stock price by the per-share operating cash flow. P/CF ratio is an alternative method to P/E ratio. Many investors prefer to use a P/CF metric because it is considered harder to manipulate cash tallies than it would be to massage earnings reports under generally accepted accounting principles, which could make the cash-based benchmark a more reliable indicator.
Price/earnings-to-growth (PEG)
Price/earnings-to-growth ratio is the relationship between the P/E ratio and the projected earnings growth of a company. It is calculated by dividing the P/E ratio by the earnings-per-share growth. For example, if a company’s P/E ratio is 16.5 and its earnings-per-share growth over the next 3 years is expected to be 10.8%, its PEG ratio would be 1.5. A PEG of 1 or less is typically taken to indicate that the company is undervalued. A PEG of more than 1 is typically taken to indicate that the company is overvalued. To get a clearer picture of value, the PEG of the company should also be compared with the PEG of the market and with the industry that the company competes in.
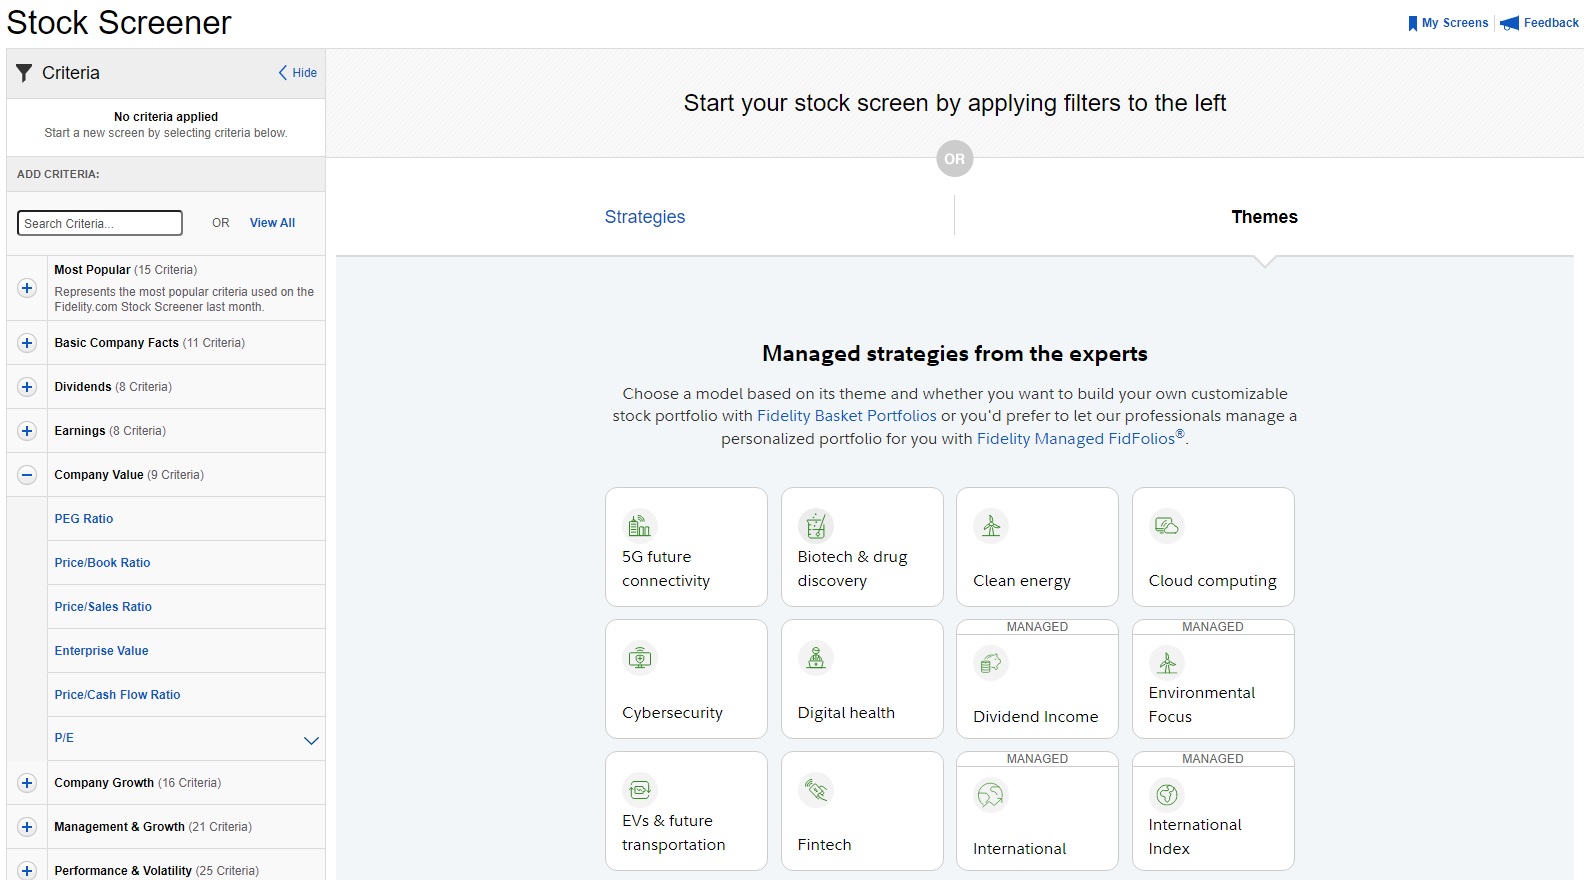
You can screen by the Company Value criteria discussed in this lesson when using the Fidelity.com Stock Screener. Please see below.


