Estimate Time6 min

How inflation could impact retirement savings

Key takeaways

  • Good financial habits like budgeting and diligently saving are critical to thriving in difficult economic circumstances.
  • Maintaining or even increasing your retirement savings rate during times of high inflation can help ensure the success of your plan.
  • If you experience a setback—don't panic. There are several ways to get your retirement savings back on track.
  • Staying invested through bad markets can also be key. When markets resume their historical trend upward, you will likely be positioned to benefit from the recovery.

Inflation has hit everyone where it hurts—in the wallet. But there's some good news if you save through a workplace retirement plan. Your savings may already have inflation protection built in if you save a percentage of your income versus choosing the option to save a fixed amount—which may be an option offered by your employer. If you're lucky enough to get regular raises or salary increases, using the option to save a percentage of your income will help ensure that the amount you're saving will increase as your income does.

Annual salary increases are one of the assumptions behind Fidelity's retirement guidelines. A hypothetical saver who earns $60,000 at age 40 and saves 15% of her income each year, including an employer match, would see the amount saved increase by an average of $490 per year. That assumes a 4% annual salary increase, no withdrawals or loans, and a retirement age of 67. (The 4% salary growth rate assumption includes 2.5% inflation and 1.5% excessive growth above inflation.1)

Consider that in retirement, even moderate inflation can drive your annual expenses up over time. Your expected retirement expenses are a key factor in deciding how much you may need to save for retirement.
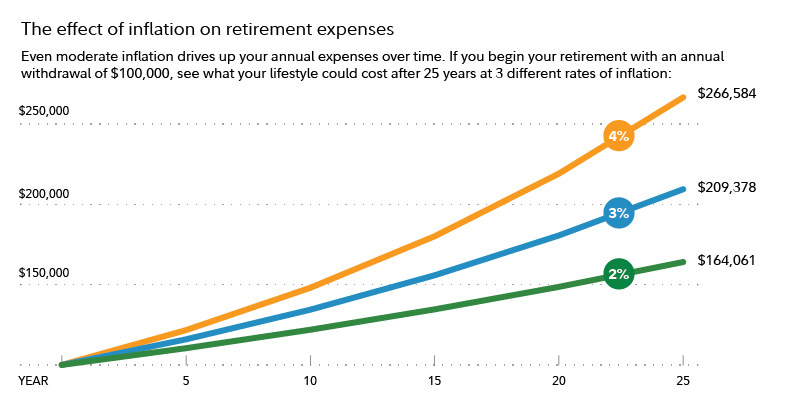
Even moderate inflation drives up your annual expenses over time. If you begin your retirement with an annual withdrawal of $100,000, see what your lifestyle could cost after 25 years at 3 different rates of inflation.

Here are 5 time-tested strategies to keep your retirement savings on track despite rising prices and stock market volatility.

Fight rising prices with a budget

With rising costs, many are looking for ways to save money and trim extra expenses.

"There aren't really any magic bullets," says David Peterson, head of wealth planning at Fidelity. "I know people hate the word budget. But it can make sense for people to sharpen their pencils on their budgets. Understanding where the money goes can help you evaluate where to potentially reduce or cut back, if needed."

Here's what Fidelity's 50/15/5 budget guideline suggests:

  • Spending no more than 50% of your take-home pay on essential expenses.
  • Saving at least 15% of your pre-tax income for retirement, including any match from an employer.
  • Saving 5% of your take-home pay for emergencies or short-term goals.

Keeping your spending and saving aligned to these guideposts can help keep your financial boat afloat amid rising inflation.

Fidelity Viewpoints

Sign up for Fidelity Viewpoints weekly email for our latest insights.


Invest in yourself

Reducing your expenses through budgeting can help in the short term. But for a longer-term solution, it may make sense to focus on ways to boost your earnings potential, if possible. "In the longer term, you can have more control over the amount of money you have coming in through improving your skill set," Peterson says.

If there are ways to improve your earning potential, it can make sense to take the plunge when you can. Be advised that there can be a cost involved, usually money and a hefty amount of time. But adding skills or education has the potential to improve your financial position in the long run.

Keep saving through periods of high inflation

Families hit hard by inflation may struggle to keep saving at their previous rates. Don't give up if you find yourself in that predicament: You can catch up if inflation keeps you from saving as much as you would like. Here are the ways to come back from a saving setback:

  • Save more later
  • Work longer
  • Spend less in retirement
  • A combination of all 3

The example below shows the outcome at retirement in several different scenarios. As you can see, even with a saving setback, if you're able to get back to saving consistently and catch up later in your working years, the outcome can be improved significantly. Working longer and spending less in retirement could further boost the odds of a successful retirement.
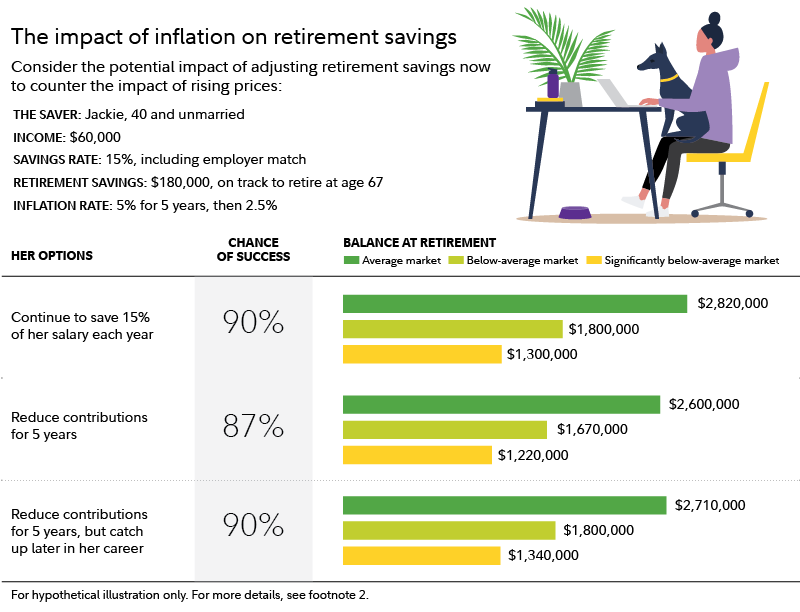
Consider the potential impact of adjusting retirement savings now to counter the impact of rising prices.

Saving for retirement is a lifelong project that can take many twists and turns. With myriad uncertain and uncontrollable factors contributing to the outcome of your plan, the best thing individuals can do to help ensure success is consistently save and invest.

The key variables that you can control are the amount you save and when in life you start saving. The best time to start is at the beginning of your career but the next best time is now—or as soon as you're able to start.

Keep investing through uncertainty

On any given day, the world is an uncertain place. But it's important to keep it in perspective. Recency bias lends heavy weight to news and events that just happened. Events that are happening now feel much more urgent than something that happened 5 months or 5 years ago.

This is where the value of a financial plan can really shine. Having a plan can give you peace of mind that you're on the right track.

Here are 3 actions that an investor saving for retirement could have taken during the Global Financial Crisis in 2007–2009 and the long-term effect on their savings.

Give up: Sell all stocks and stop making contributions. Bail out: Sell all stocks and leave the money in cash, but keep saving. Stick with it: Don't sell. Continue making new workplace contributions and stick with their investment plan, including annual rebalancing.

As you can see, continuing to save and invest through the Global Financial Crisis would have helped the investor's account recover from the downturn and take advantage of subsequent growth.

The investor who stuck with their investment plan through the Global Financial Crisis would have seen their portfolio breakeven by late 2009 and then move into positive territory.  The investor who moved to cash and continued contributing would have hit the breakeven mark in 2011.
The underwater duration was 52 months during the Global Financial Crisis. The chart assumes that the hypothetical investor entered the downturn with 70% stock/30% bond mix, an account balance of $400,000, and a baseline annual contribution to the workplace plan of $15,000. The decision to move to cash in this example was triggered by a 20% decline in the account. See footnote 3 for more information. Source: Fidelity Investments.

Control investment taxes and fees

Consider the cost of investing. Every dollar counts when you're hoping for long-term compounding and appreciation.

"There are 3 main drags on performance: inflation, taxes, and fees,” says Fidelity’s Peterson. “Be sure to talk to a tax professional on how to manage taxes. Additionally, it's important to evaluate what it costs to invest, and this, of course, is where Fidelity has advantages over many competitors in the marketplace.”

Read more about pricing and fees at Fidelity: Value you expect from Fidelity

The value of a plan

Financial planning can help you find a way to keep working toward your goals when the future seems unclear. Though you may not always be making as much progress as you would like, a plan can provide milestones to aim for.

If you're not ready to build a financial plan yourself, consider working with a financial professional.

Ready to open a retirement account?

Opening a new account takes just minutes.

More to explore

1. Earnings and pre-tax contributions are subject to taxes when withdrawn. Distributions before age 59 1/2 may also be subject to a 10% penalty. Contribution amounts are subject to IRS and Plan limits. Systematic investing does not ensure a profit or guarantee against a loss in a declining market. This example is for illustrative purposes only and does not represent the performance of any security. Consider your current and anticipated investment horizon when making an investment decision, as the illustration may not reflect this. The assumed rate of return used in this example is not guaranteed.

2. This example assumes a hypothetical single 40-year-old person. This individual earns $60K a year, and currently has $180K invested in a target-date fund. The plan to retire at age 67 and claim Social Security at retirement. The annual spending in retirement is around $60K a year in today's dollars. The "plan to" age is 95. The baseline scenario assumes saving 15% (12% from individual and 3% from employer match) of earned income annually. The reduced contribution assumes reduce saving rate to 6% (3% from individual and 3% from employer match). The catch-up contribution starts at age 55 and increases the saving rate to 20% (17% from individual and 3% from employer match). All balances are in future dollars and rounded to the nearest $10,000. The chance of success is rounded to the nearest 1%. Example assumes no withdrawals during the accumulation period. The illustration uses Monte Carlo simulations to project a range of hypothetical market return scenarios. Simulations are based on a historical performance analysis of asset class returns, including a range of potential returns for each asset class, volatility, and correlation. Asset classes are represented by benchmark return data from Morningstar, Inc., not actual investments. Stocks (Domestic and Foreign) are represented by the S&P 500® Index from the year 1926 through 1986 and the Dow Jones U.S. Total Market Index from 1987 through the last calendar year. Bonds are represented by U.S. intermediate-term bonds from 1926 through 1975 and the Bloomberg Barclays U.S. Aggregate Bond Index from 1976 through the last calendar year. Short-Term investments are represented by 30-day U.S. Treasury bill rates from 1926 through the last calendar year. Indexes are unmanaged and it is not possible to invest directly in an index. Annual returns assume the reinvestment of interest income and dividends, no transaction costs, no management or servicing fees (except for a variable annuity fees), and the rebalancing of the portfolio every year. Performance returns for actual investments will generally be reduced by fees and expenses not reflected in this hypothetical illustration. The results are based on how an asset mix may have performed in a certain percentage of the simulated market scenarios. These percentages are called "confidence levels." For example, the default confidence level is 90%, which we consider "very conservative" market performance. This means that in 90% of the historical market scenarios run, a particular asset mix performed at least as well as the results shown. Conversely, in only 10% of the historical market scenarios run, a particular asset mix failed to reach the results shown.

3. Investment horizon is defined as from prior US stock market high, to the bottom and then to the recovery to the prior high. The investment is considered "under water" during this entire horizon. The hypothetical investor moved to cash or/and stopped contribution at an emotional trigger, which is defined as US stock market drop 20% from prior high, which is commonly defined as bear market. Illustration assumes no withdrawals taken over the time period shown. Monthly returns of the following indexes are used. Stocks: 1926-Jan 1987 US Large Cap Stocks; DJ US Total Market Feb 1987-Present. Bonds: 1926-Dec 1975 US Intermediate Bond; Barclays Agg Bond Jan 1976-Present. Short-Term: 1926 - Present IA SBBI US 30-day T-Bill. The Ibbotson Associates SBBI 30 Day T-Bill Total Return Index is an index that reflects US Treasury bill returns. Data from the Wall Street Journal are used for 1977–present; the CRSP US Government Bond File is the source from 1926 to 1976. Each month, a one-bill portfolio containing the shortest-term bill having not less than one month to maturity is constructed.

This information is intended to be educational and is not tailored to the investment needs of any specific investor.

Investment decisions should be based on an individual’s own goals, time horizon, and tolerance for risk.

Fidelity does not provide legal or tax advice, and the information provided is general in nature and should not be considered legal or tax advice. Consult an attorney, tax professional, or other advisor regarding your specific legal or tax situation.

Views expressed are as of the date indicated, based on the information available at that time, and may change based on market or other conditions. Unless otherwise noted, the opinions provided are those of the speaker or author and not necessarily those of Fidelity Investments or its affiliates. Fidelity does not assume any duty to update any of the information.

Investing involves risk, including risk of loss.

Past performance is no guarantee of future results.

Diversification and asset allocation do not ensure a profit or guarantee against loss.

Stock markets are volatile and can fluctuate significantly in response to company, industry, political, regulatory, market, or economic developments. Investing in stock involves risks, including the loss of principal.

The S&P 500® Index is an unmanaged, market capitalization-weighted index of 500 common stocks chosen for market size, liquidity, and industry group representation to present US equity performance.

Dow Jones US Total Stock Market Index is a float-adjusted market capitalization–weighted index of all equity securities of US headquartered companies with readily available price data.

Bloomberg Barclays US Aggregate Bond Index is a broad-based, market-value-weighted benchmark that measures the performance of the investment grade, US dollar-denominated, fixed-rate taxable bond market. Sectors in the index include Treasuries, government-related and corporate securities, MBS (agency fixed-rate and hybrid ARM pass-throughs), ABS, and CMBS.

Fidelity Brokerage Services LLC, Member NYSE, SIPC, 900 Salem Street, Smithfield, RI 02917

1033391.2.2