Estimate Time7 min

3 reasons to invest in stocks

Key takeaways

  • Cash and short-term investments do play an important role in your financial plan but having too much in cash can be surprisingly risky over the long term.
  • Cash offers relatively little growth potential, so you may lose purchasing power to inflation, and run the risk of falling short of your goals.
  • Stocks have historically offered more growth potential than cash or bonds, helping investors reach their goals and manage inflation.
  • A diversified mix of investments like stocks, bonds, and short-term investments can help you target the level of risk you feel comfortable with, providing some growth potential with less volatility than investing in just stocks.
  • Financial professionals can help you create a financial plan that fits your needs and could help you reach your goals.

For investors who are unsure about the stock market, cash and short-term investments can provide orderly and routine returns that feel safe and predictable. But there can be some downsides if they make up the majority or entirety of your long-term investment mix.

"Sometimes investing successfully can feel counterintuitive," says Naveen Malwal, CFA, institutional portfolio manager with Fidelity's Strategic Advisers. “I can understand why the volatility of the stock market may lead some investors to feel stocks may be risky. However, investors who focus on the growth potential of stocks, not just the downside, often reach their financial goals more easily than they would if they were investing mostly in cash.”

Here are 3 potential benefits of investing in stocks, bonds, and other investments that can provide growth potential—plus 2 ways to do that confidently and help reach your goals.

Fidelity Viewpoints

Sign up for Fidelity Viewpoints weekly email for our latest insights.


1. Your money may grow more quickly

High-yield savings accounts and safe investments like money market funds trade yield for stability. While your account value won't generally go down due to events outside your control, it may not go up very much over time either.

"Looking back historically, investing in short-term investments has been OK for investors, but nowhere near as good as in stocks, or a combination stocks, bonds, and cash. Diversifying away from cash has generally led to stronger returns for investors, which means they have often reached their financial goals more easily," Malwal says.
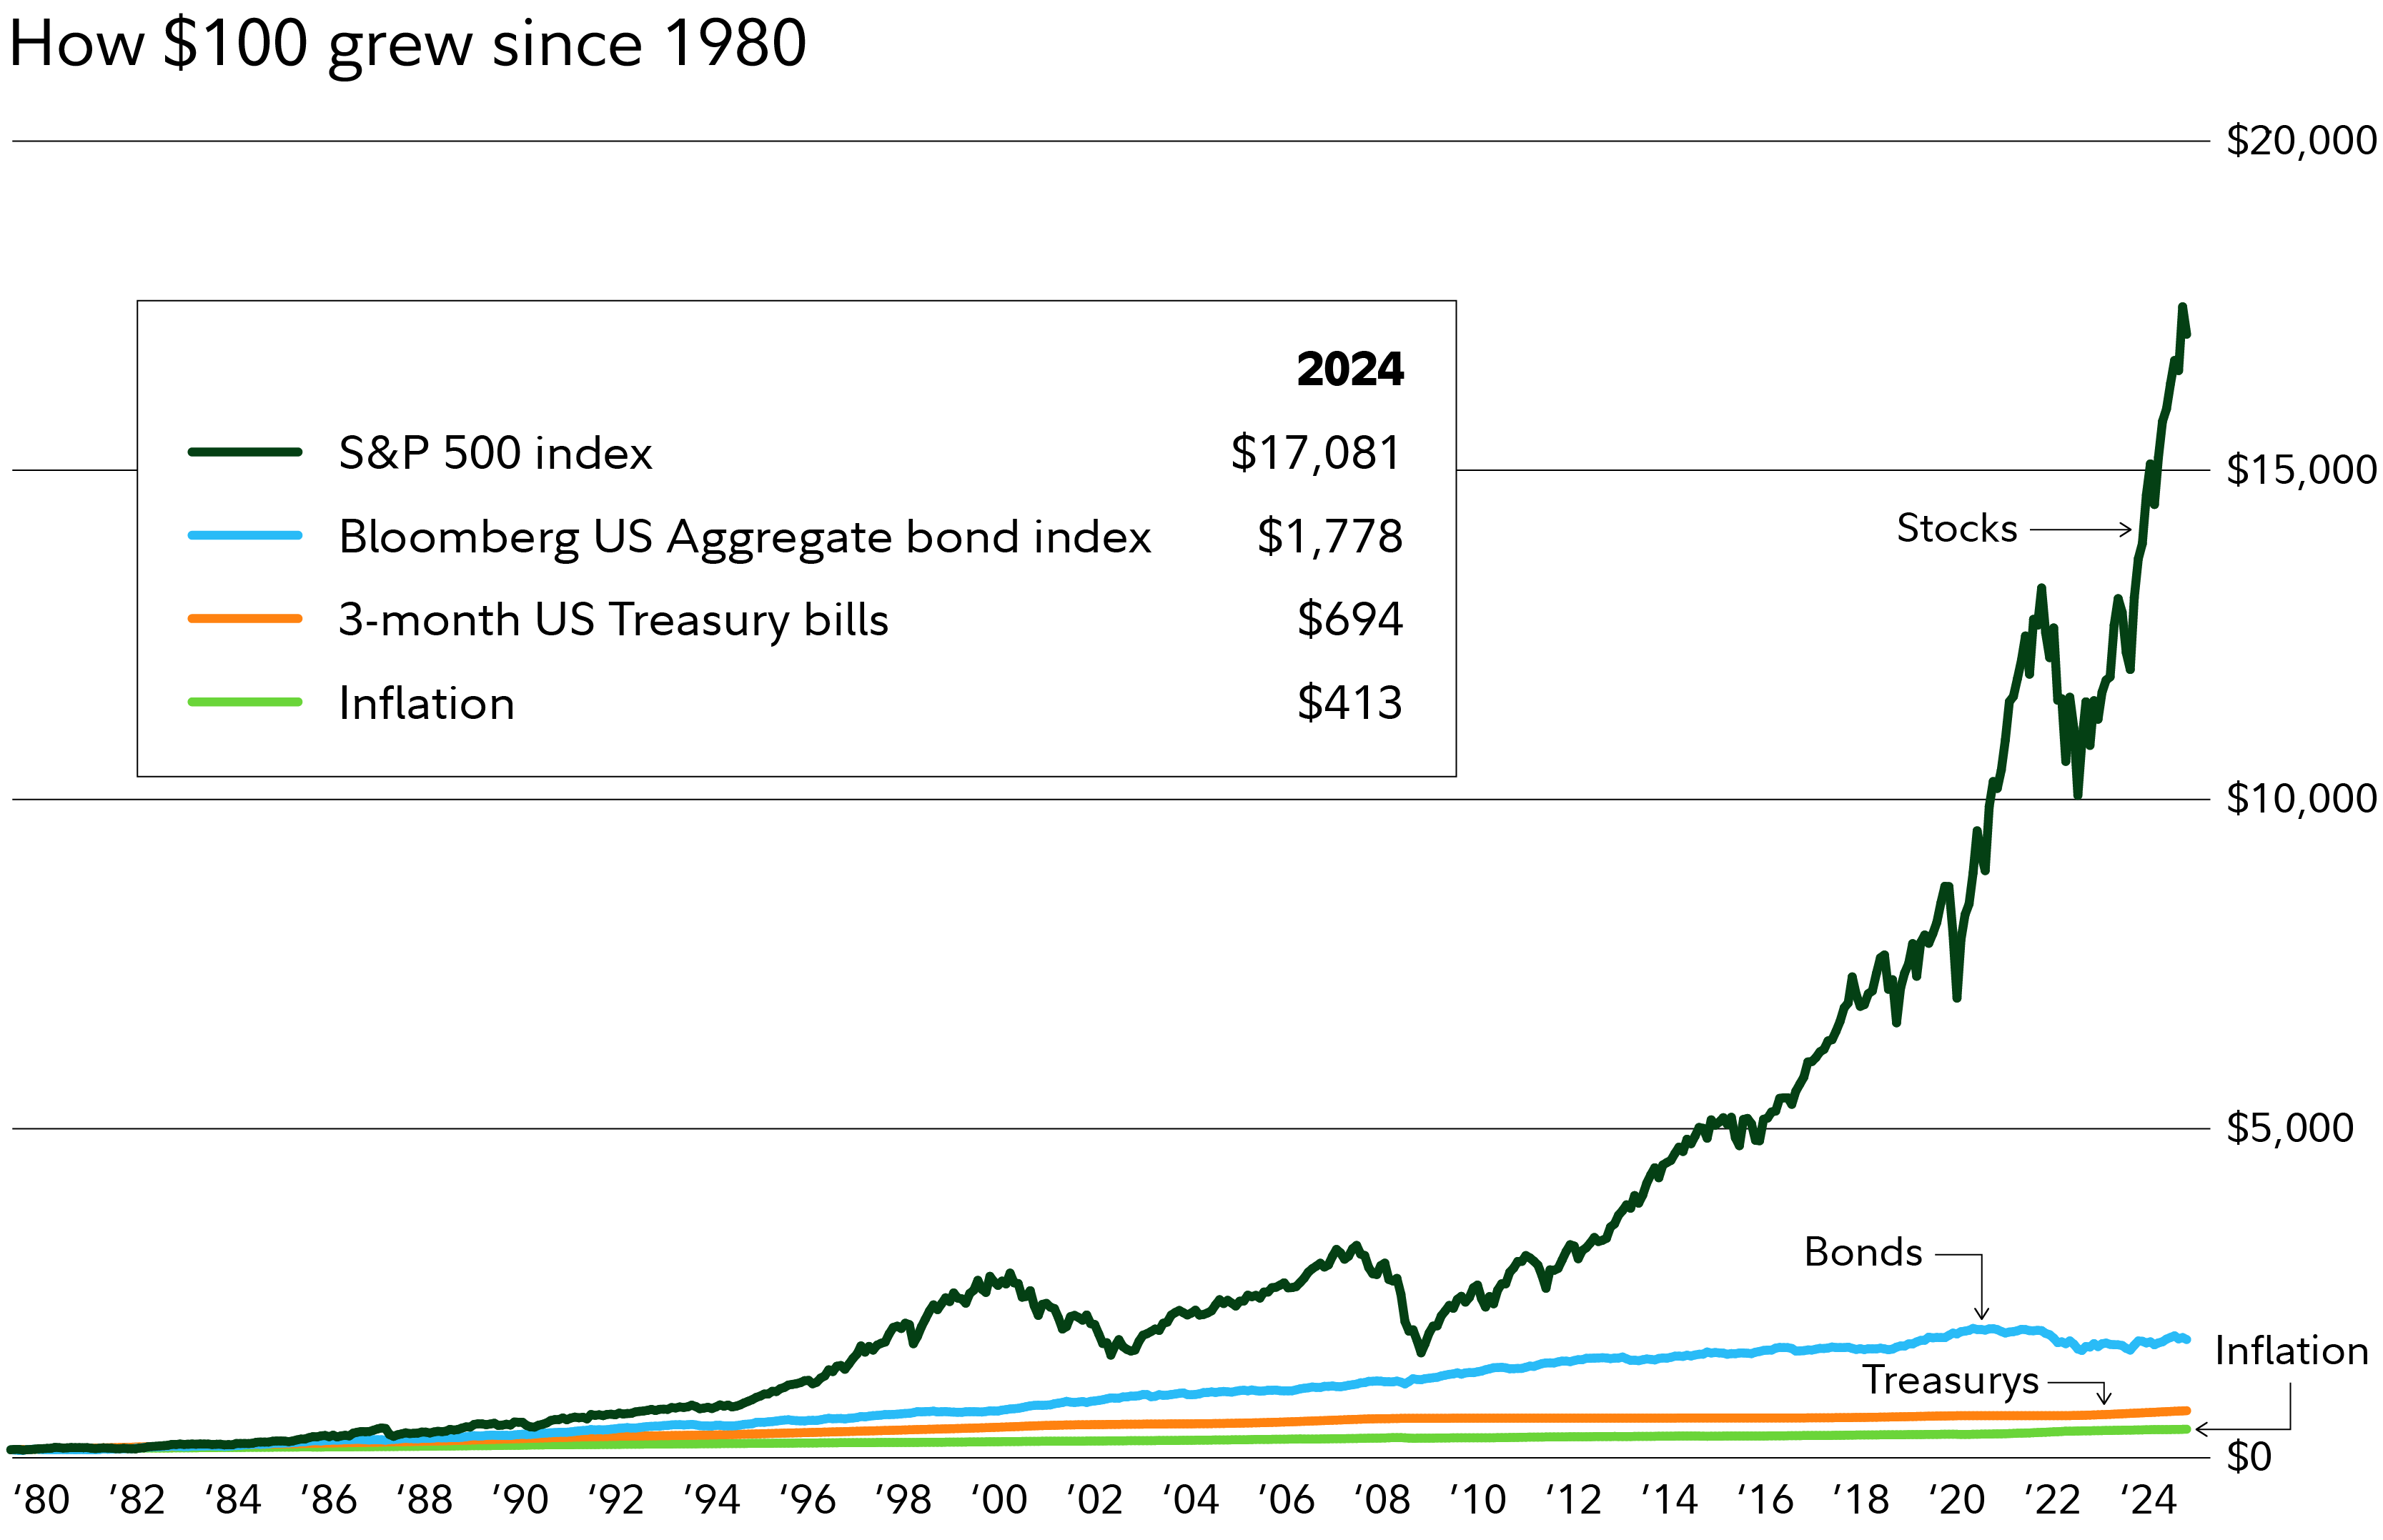
The chart shows the potential benefit of investing for growth by comparing how $100 would have grown since 1980 if it grew at the same rate as inflation, 3-month Treasurys, bonds, or the S&P 500 Index. At the end of 2023, $100 would have grown to 13,665 in the stock index compared to 660 in Treasurys or 1,756 in bonds.
Strategic Advisers. Hypothetical value of assets held in untaxed portfolios invested in US stocks, bonds, or short-term investments. Actual historical data were used to compute the growth of $100 invested in these portfolios for the period between Jan. 1, 1980 and Dec. 29, 2023. Stocks, bonds, and short-term investments are represented by total returns of the S&P 500 Index, Barclays Aggregate Bond Index, 3-month Treasury Bills. Past performance is no guarantee of future results.

2. You can fight inflation and help maintain purchasing power

Inflation is something that everyone has experienced, particularly in recent years. It's hard to miss that your money doesn't go as far as it used to—your usual purchases like groceries and prescriptions may be taking up a bigger chunk of your paycheck or savings than they used to.

Earning a rate of return higher than the rate of inflation can help ensure that you're able to continue to afford the things you want to buy. Unfortunately, "the return on short-term investments over the long run has barely kept up with inflation, so it's hard to stay ahead, especially when inflation is surprisingly high—as it was just a couple of years ago," says Malwal.

A related risk of staying in relatively safer areas like savings accounts, Treasurys, and CDs can be reinvestment risk. When the Federal Reserve raises interest rates, savers can benefit as yields rise. But when the Fed lowers interest rates, the yield on safer investments tends to go down. So it can be hard to replace a maturing investment with another one with the same risk and return.

For example, let's say you buy a 3-year CD today with a 5% annual percentage yield (APY). Then over the 3-year term, interest rates fall. When your CD matures and you want to buy another one, you may have to accept lower yields or buy a longer-term CD. There's no guarantee that you will be able to reinvest your money at the same level of risk and receive the same level of return in the future.

"If the return on a short-term investment decreases, for example from 5% to 4%, due to declining interest rates, an investor can have a harder time staying ahead of inflation," says Malwal.

Read Viewpoints on Fidelty.com: How to plan for the worst and stay invested

3. You may have a better shot at reaching your goals

Retirement is one big goal most people have, but there are myriad other goals that you may be working toward: a dream vacation, a wedding, a big party, a new car, remodeling the kitchen, and so on. If there are several years until your goal, investing for more growth potential could potentially help you successfully reach or exceed your goal.

"By investing in a more diverse mix of stocks and bonds and short-term investments, the investor has a higher chance of achieving their goal, potentially with a couple of added benefits. With a higher rate of return, they may reach their goal quicker. And, once they actually reach the end of their time frame, they could have more money than they otherwise would have. The possibility of having more to spend in the future would be a potential benefit that the saver could miss out on compared to a cash investor," says Malwal.

More than 1 in 10 retirement investors has an investment mix that Fidelity would consider too conservative for their time frame.1,2 A little extra return could potentially improve their chances of maintaining their lifestyle in retirement.
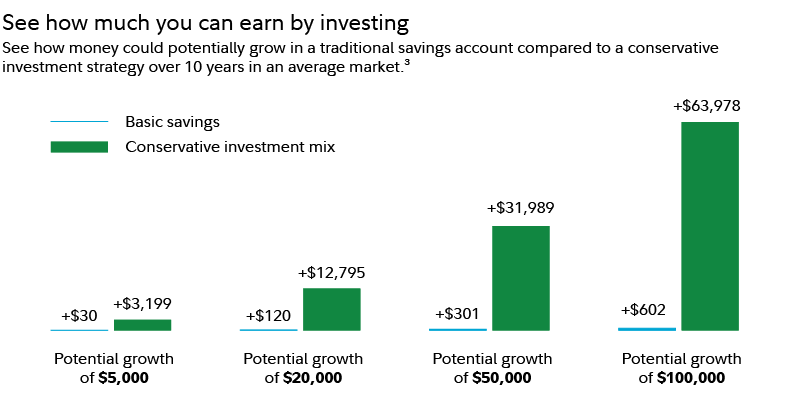
Comparing the potential growth of a basic savings account with a conservative investment mix shows the potential benefits of investing. Investing $100,000 in a savings account over 10 years could lead to $602 of growth versus the conservative investment mix, which could return $63,978.
Estimates are based on historical returns. A conservative Investing mix is based on 20% stocks, 50% bonds, 30% short term investments. Past performance is not indicative of future results. Investing involved risk, including the risk of loss. The investment strategies presented here have different fees, guarantees and risk, and you should carefully consider these prior to investing. Please see footnote 3 for additional important information.

Diversification may be a better way to manage investment risk

There's no perfect investment that offers the best of all worlds—low risk and high returns. But there is a way to take advantage of the many different patterns of investment risk and return: diversification.

Diversification can be a helpful strategy because different types of investments offer varying levels of risk and return. Some types of investments may outperform during economic downturns while others shine brightest during boom times. Some investments may do well as interest rates rise while others get a boost from low interest rates.

The goal of diversification is not necessarily to boost performance—it won't ensure gains or guarantee against losses. But diversification does have the potential to improve returns for whatever level of risk you choose to target.

A risk-averse investor could still invest in short-term investments like money market funds, CDs, and Treasurys with the addition of bonds and a small portion of equities. By mixing riskier investments with some relatively safer choices, they may be able to get a higher return while still keeping the risk of losing money low.

If you’re not sure how to do it yourself, there’s good news: Financial professionals can help you pick investments and balance the need for principal protection with the need for some growth potential. By determining an appropriate rate of return to target based on your financial situation, time frame, and comfort with risk—while accounting for inflation—professionals can work with you to determine what investments and strategies may fit your goals. And they can help in many more ways as well.

Read Viewpoints on Fidelity.com: The guide to diversification

Risk versus return
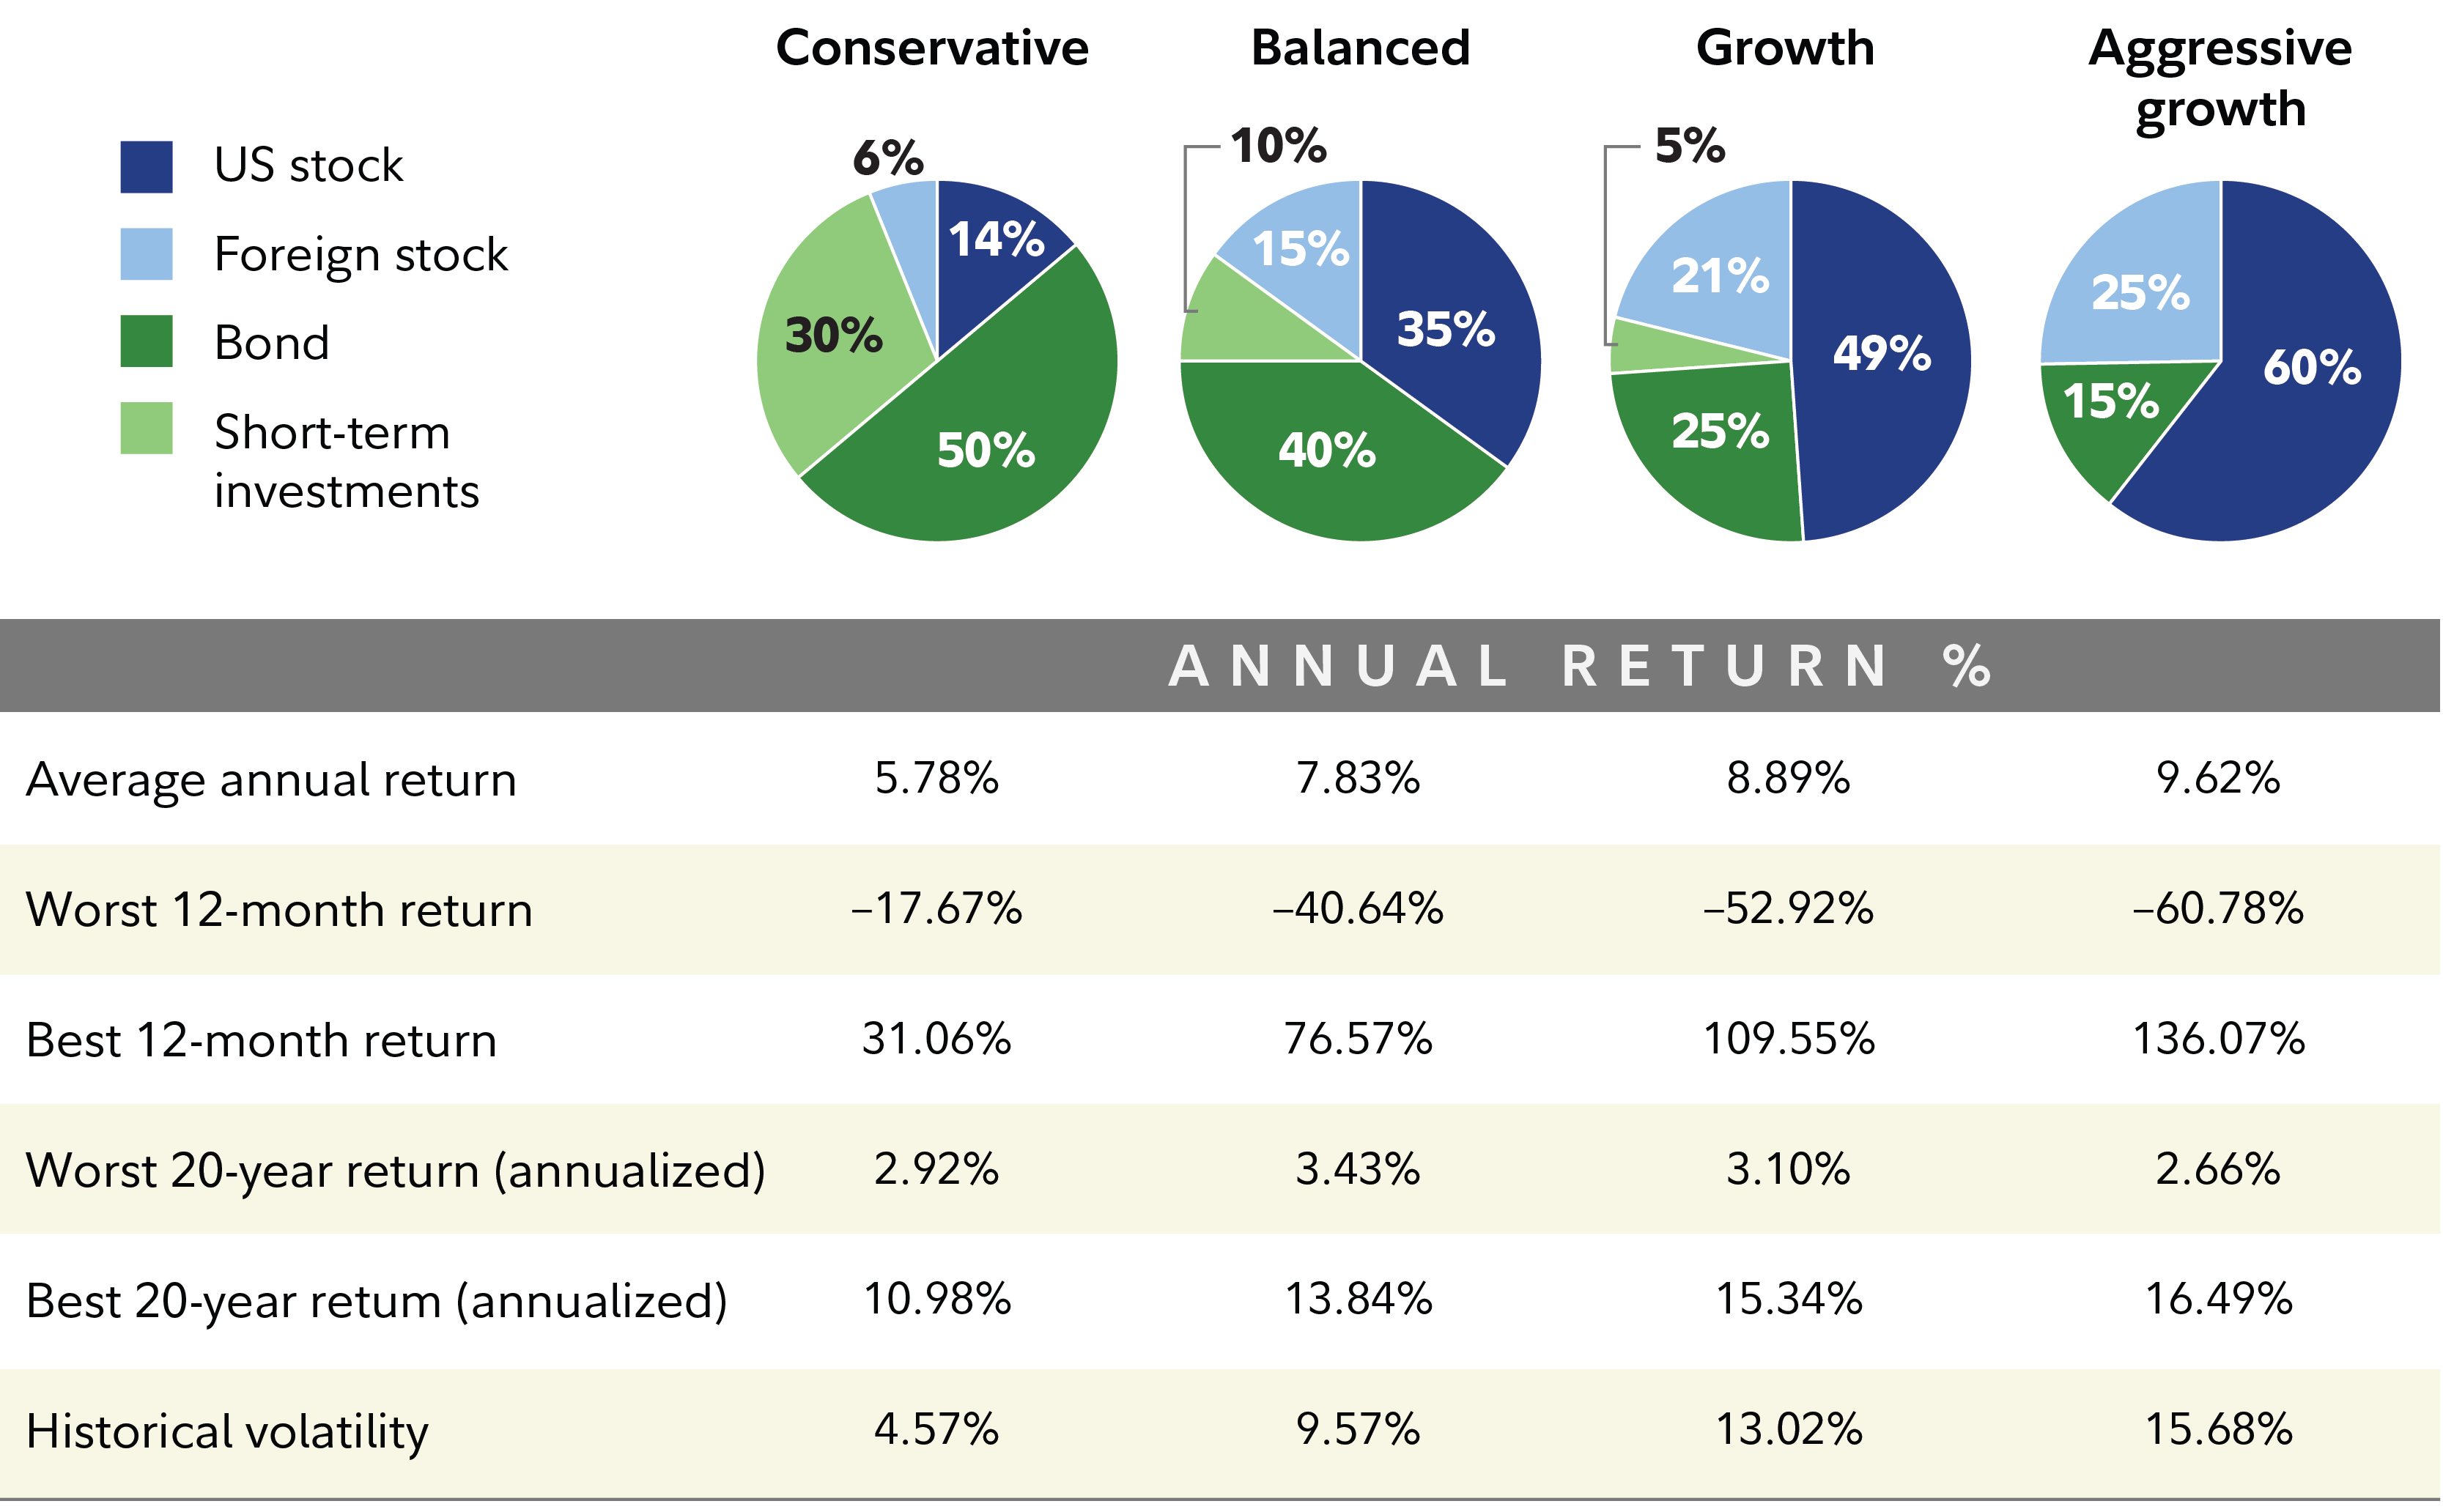
This chart show the potential benefits and risks of investing. The average annual return of a conservative investment mix has historically been 5.78% versus 9.56% for an aggressive growth mix. The worst 12-month return for the conservative mix was -17.67% compared to -60.78% for aggressive growth.
Data source: Fidelity Investments and Morningstar Inc. 2023 (1926–2023).4 Past performance is no guarantee of future results. Returns include the reinvestment of dividends and other earnings. This chart is for illustrative purposes only. It is not possible to invest directly in an index. Time periods for best and worst returns are based on calendar year. For information on the indexes used to construct this table see Data Source in the notes below. The purpose of the target asset mixes is to show how target asset mixes may be created with different risk and return characteristics to help meet a participant's goals. You should choose your own investments based on your particular objectives and situation. Remember, you may change how your account is invested. Be sure to review your decisions periodically to make sure they are still consistent with your goals. You should also consider any investments you may have outside the plan when making your investment choices.

Financial professionals are here to help

Working with a trusted professional can help boost your confidence about your money and investing—a recent survey found that investor confidence about reaching their long-term goals increases significantly after working with a financial professional.5

Getting professional help can be affordable as well. For straightforward investment management, robo advisors can simplify the investment process. Fidelity’s robo advisor, Fidelity Go®, is a hybrid robo advisor. With a balance of $25,000 or more, you can speak on the phone with a professional for live, personalized coaching.

Read Smart MoneySM on Fidelity.com: What’s a robo advisor, and how does it work?

Your financial picture probably includes so much more than investments. Working with a professional can help you understand how all the pieces fit together by asking you about your personal and financial goals, and working with you to help answer questions such as:

  • Are your spending and cash flow appropriate?
  • What does financial protection mean to you, and how important is it?
  • What does growth mean to you, and how important is it?
  • Are your investments aligned with your preferences?
  • How will you manage your investment portfolio?

"As they discuss their situation with a financial professional, many investors learn about other opportunities, so it may turn out that they don't have to take that much more risk to get the benefit of a more diversified set of investments," Malwal says.

"Perhaps they do still want to keep most of their investments in a short-term space, but there's a smaller portion they would be willing to allocate to stocks and bonds. That combination may be enough for them to feel that their money is relatively secure, and they have a better chance of staying ahead of inflation and reaching a long-term goal," he says.

Knowing that you have options and that you've made an informed choice can help you feel more in control. While the stock market may go up and down more than most people would like, your investment mix doesn't have to be as volatile to provide growth potential. If you're not sure how to create a financial plan that includes an appropriate investment mix for your situation, consider working with a financial professional.

Looking for help with investing?

We've got you covered with our options for simple investing and financial advice.

More to explore

1. "Retirement Savings Assessment 2023: Retirement preparedness during uncertain times," 03/21/2023; Fidelity.com; Fidelity Investments; https://newsroom.fidelity.com/pressreleases/fidelity-research--america-s-retirement-preparedness-level-declines-amid-continued-volatility/s/c57ac0e9-9c5c-4f5c-938c-cdf82a3aa7b1 2. Age-appropriate asset allocation involves investing in a mix of stocks and fixed-income investments to align with one’s risk-tolerance, age, and time horizon. “Appropriate” refers to what Fidelity considers to be an appropriate mix, derived from data reported in the Retirement Savings Assessment about an individual’s equity allocation distribution that is placed into four categories, based on that person’s age. Those categories are “On track”: within 25 percent on target date equity allocation; “Aggressive”: an equity percentage more than 25 percent above the age-appropriate target equity; “Conservative”: an equity percentage less than 25 percent below the age-appropriate equity target; as well as a category for assets held in a Target Date Fund.

3. Methodology for investing returns example: Estimates derived using Fidelity Goal Booster. Estimates are based on past performance. Past performance does not predict future results. The timing of deposits and when you are looking to use the money can impact potential return as well as which savings or investment options may be right for you. Hypothetical models include the following assumptions:

  • The average market return corresponds to the 50th percentile of the returns. Conservative Investing mix is based on 20% stocks, 50% bonds, 30% short term investments. Estimated/Average return rates stay constant over the course of the goal timeframe
  • You won’t make any withdrawals from the account during the goal timeframe
  • No fees or taxes will be applied
  • Your starting amount and monthly contributions are invested in the model allocation in the stated time period
  • Investments in “traditional savings” and “locked savings” assumes only FDIC insured accounts or certificates of deposits are used

For investing returns, calculations are made by computing the 1, 2, 3, 4, 5, 6, 7, 8, 9, and 10-year average annual returns based on monthly historical performance of stocks, bonds, and short-term instruments from 1926–2022, obtained from Ibbotson Associates. These are hypothetical and therefore past performance is no guarantee of future results. Returns include the reinvestment of dividends and other earnings. The assets are rebalanced monthly to the stated asset mix. Any chart is for illustrative purposes only and does not represent actual or implied performance of any investment option.


Stocks are represented by the Dow Jones Total Market Index from March 1987 to latest calendar year. From 1926 to February 1987, stocks are represented by the Standard & Poor’s 500® Index (S&P 500® Index). The S&P 500® Index is a market capitalization-weighted index of 500 common stocks chosen for market size, liquidity, and industry group representation to represent U.S. equity performance. Bonds are represented by the Barclays U.S. Aggregate Bond Index from January 1976 to the latest calendar year. The Barclays U.S. Aggregate Bond Index is a market value-weighted index of investment-grade fixed-rate debt issues, including government, corporate, asset-backed, and mortgage-backed securities, with maturities of one year or more. From 1926 to December 1975, bonds are represented by the U.S. Intermediate Government Bond Index, which is an unmanaged index that includes the reinvestment of interest income. Short-term instruments are represented by U.S. Treasury bills, which are backed by the full faith and credit of the U.S. government. The average market return corresponds to the 50th percentile of the returns, the below average market return corresponds to the 25th percentile of the returns, and the significantly below average market return corresponds to the 10th percentile of the returns. Savings returns are calculated using a national average savings account rate from FDIC. Locked rate savings returns are calculated using national average CD rates for 1-, 2- and 5-year CDs from BankRate. CDs are assumed to be purchased once and are not being rolled over upon maturity. When purchasing CDs from within a savings account, all additional monthly contributions into the savings account, as well as continuing savings with the proceeds of a CD after it matures, are assumed to be earning a national average saving account rate from FDIC.

4. Data Source: Fidelity Investments and Morningstar Inc. Hypothetical value of assets held in untaxed portfolios invested in US stocks, foreign stocks, bonds, or short-term investments. Historical returns and volatility of the stock, bond, and short-term asset classes are based on the historical performance data of various unmanaged indexes from 1926 through the latest year-end data available from Morningstar. Domestic stocks represented by IA SBBI US Large Stock TR USD Ext Jan 1926-Jan 1987, then by Dow Jones US Total Market data starting Feb 1987 to Present. Foreign stocks represented by IA SBBI US Large Stock TR USD Ext Jan 1926–Dec 1969, MSCI EAFE Jan 1970-Nov 2000, then MSCI ACWI Ex USA GR USD Dec 2000 to Present. Bonds represented by US Intermediate-Term Government Bond Index Jan 1926–Dec 1975, then Barclays Aggregate Bond Jan 1976 - Present. Short-term/cash represented by 30-day US Treasury bills beginning in Jan 1926 to Present. Past performance is no guarantee of future results. The purpose of the target asset mixes is to show how target asset mixes may be created with different risk and return characteristics to help meet an investor's goals. You should choose your own investments based on your particular objectives and situation. Be sure to review your decisions periodically to make sure they are still consistent with your goals. 5. 2021 Fidelity Investor Insights Study. Conducted between May 15 and June 7, 2021, it surveyed a total of 1,974 investors, including 773 millionaires. The study was conducted via a double-blind online survey. Investing involves risk, including risk of loss. Stock markets are volatile and can fluctuate significantly in response to company, industry, political, regulatory, market, or economic developments. Investing in stock involves risks, including the loss of principal.

Past performance is no guarantee of future results.

Fidelity does not provide legal or tax advice. The information herein is general and educational in nature and should not be considered legal or tax advice. Tax laws and regulations are complex and subject to change, which can materially impact investment results. Fidelity cannot guarantee that the information herein is accurate, complete, or timely. Fidelity makes no warranties with regard to such information or results obtained by its use, and disclaims any liability arising out of your use of, or any tax position taken in reliance on, such information. Consult an attorney or tax professional regarding your specific situation.

An investment in a money market fund is not insured or guaranteed by the Federal Deposit Insurance Corporation or any other government agency. Although the fund seeks to preserve the value of your investment at $1.00 per share, it is possible to lose money by investing in the fund.

Any fixed income security sold or redeemed prior to maturity may be subject to a substantial gain or loss. Your ability to sell a CD on the secondary market is subject to market conditions. If your CD has a step rate, the interest rate may be higher or lower than prevailing market rates. The initial rate on a step-rate CD is not the yield to maturity. If your CD has a call provision, which many step-rate CDs do, the decision to call the CD is at the issuer's sole discretion. Also, if the issuer calls the CD, you may obtain a less favorable interest rate upon reinvestment of your funds. Fidelity makes no judgment as to the creditworthiness of the issuing institution.

Diversification and asset allocation do not ensure a profit or guarantee against loss.

Views expressed are as of the date indicated, based on the information available at that time, and may change based on market or other conditions. Unless otherwise noted, the opinions provided are those of the speaker or author and not necessarily those of Fidelity Investments or its affiliates. Fidelity does not assume any duty to update any of the information.

The Chartered Financial Analyst (CFA®) designation is offered by the CFA Institute. To obtain the CFA charter, candidates must pass three exams demonstrating their competence, integrity, and extensive knowledge in accounting, ethical and professional standards, economics, portfolio management, and security analysis, and must also have at least 4,000 hours of qualifying work experience completed in a minimum of 36 months, among other requirements. CFA is a trademark owned by CFA Institute.

IMPORTANT: The projections or other information generated by the Fidelity Go analysis tool regarding the likelihood of various investment outcomes are hypothetical in nature, do not reflect actual investment results, and are not guarantees of future results. Results may vary with each use and over time.

All indexes are unmanaged, and performance of the indexes includes reinvestment of dividends and interest income, unless otherwise noted. Indexes are not illustrative of any particular investment, and it is not possible to invest directly in an index.

Index definitions


**The S&P 500® Index** is a market capitalization-weighted index of 500 common stocks chosen for market size, liquidity, and industry group representation to represent US equity performance.


The Bloomberg Barclays US Aggregate Bond Index is a broad-based flagship benchmark that measures the investment grade, US dollar-denominated, fixed-rate taxable bond market. The index includes Treasuries, government-related and corporate securities, mortgage-back securities (agency fixed-rate pass-throughs), asset-backed securities and collateralised mortgage-backed securities (agency and non-agency).

Fidelity Brokerage Services LLC, Member NYSE, SIPC, 900 Salem Street, Smithfield, RI 02917

1136860.1.0