Estimate Time5 min

How do your retirement savings stack up?

Key takeaways

  • For baby boomers, the average 401(k) balance is $250,900 with an average IRA balance of $250,966.
  • For Gen X, the average 401(k) balance is $191,900. The average IRA balance is $100,169.
  • Millennials have an average 401(k) balance of $66,500. The average IRA balance is $24,097.
  • Gen Z investors have an average 401(k) balance of $13,000 and an average IRA balance of $6,497.

It's easy to feel like everyone has their financial act together—everyone, that is, except you. But the truth is, many people are anxious about their financial standing and wonder how they're doing, especially when it comes to retirement savings.

To get a sense for how you're doing compared to other people, you may want to look at the average retirement savings by age. That way, you can compare your retirement savings with people who have been working and saving for about the same amount of time as you. Of course, you'll also want to see if you're on track for your retirement—fortunately Fidelity does have an easy guideline that can help (more on that later).

Fidelity Viewpoints

Sign up for Fidelity Viewpoints weekly email for our latest insights.


Average retirement savings by age

Nailing down retirement savings by age can be difficult because people may have money saved outside of 401(k)s and IRAs. Real estate, brokerage accounts, savings accounts, nonretirement CDs—and even health savings accounts—could all be earmarked for someone's retirement. But a look at 401(k) and IRA balances can give you a rough measure of how you are doing compared to your peers.
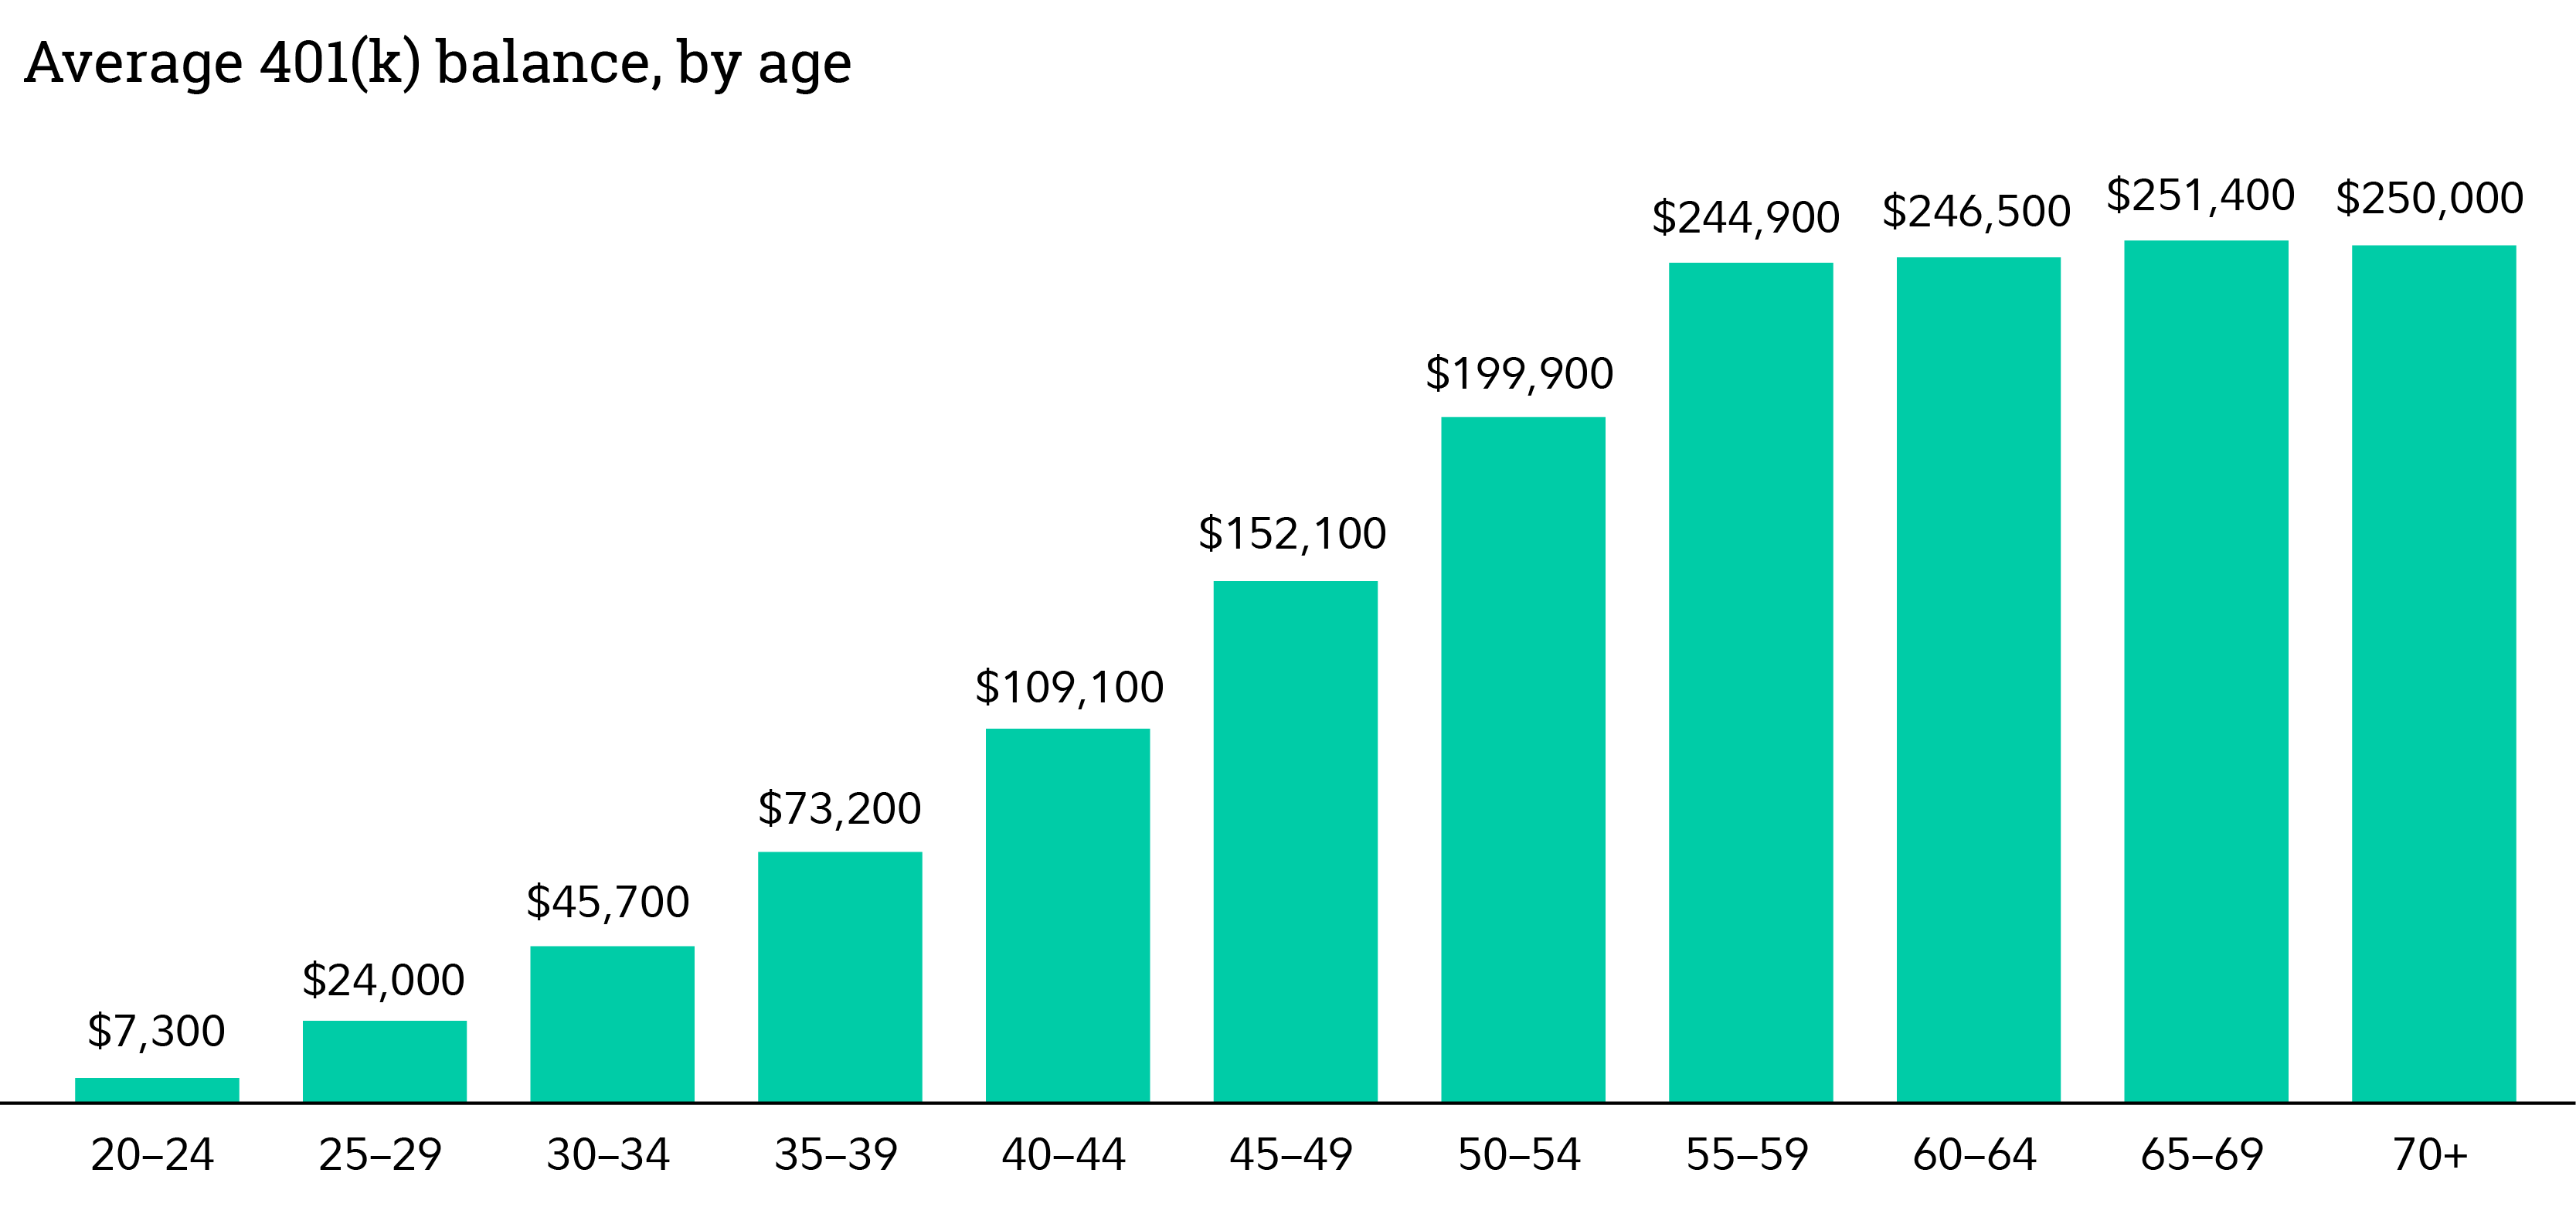
The retirement savings by age chart shows average 401(k) balances by age. The average for ages 20‐24 is $7,000; 25‐29 is $24,100; 30‐ is 34, $46,000; 35‐39 is $74,000; 40‐44 is $110,200; 45‐49 is $154,000; 50‐54 is $201,400; 55‐59 is $246,800; 60‐64 is $247,900; 65‐70 is $252,800; and for ages 70+, the average is $252,100.
Source: Fidelity Investments Q3 2024 401(k) data based on 26,400 corporate defined contribution plans and 24.4 million participants as of September 30, 2024. These figures include the advisor-sold market but exclude the tax-exempt market. Excluded from the behavioral statistics are non-qualified defined contribution plans and plans for Fidelity's own employees.

Average retirement savings by generation

Not surprisingly, older generations have saved more than the younger ones. Note that the average savings rate overall is 14.1%, which is close to 15%, the amount that Fidelity suggests saving to maintain your lifestyle in retirement (it includes any match from your employer).
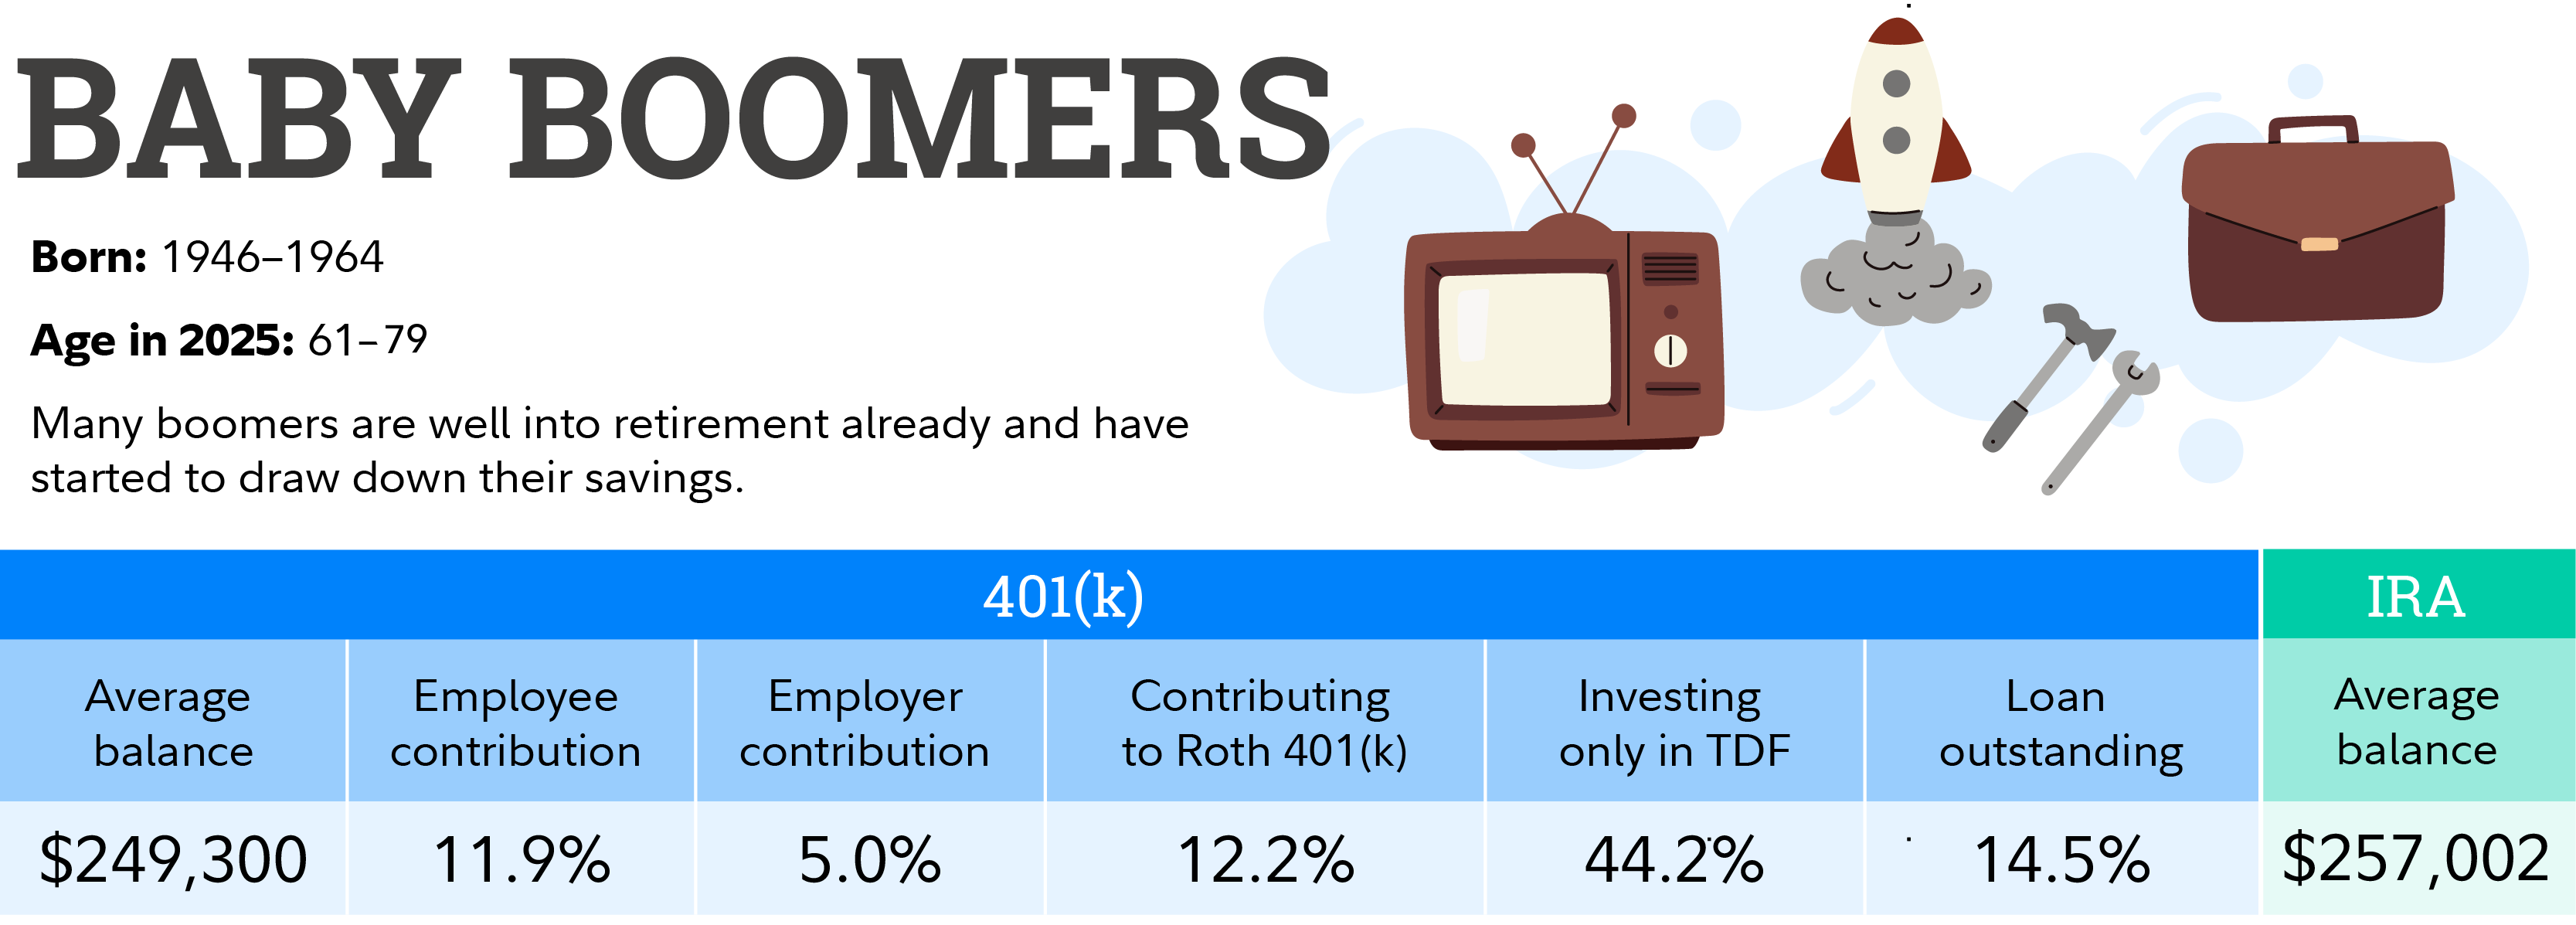
The average 401(k) balance for baby boomers is $250,900. The average baby boomer employee contribution is 11.8%, the average employer contribution is 5.1%. 12% of employees contribute to a Roth 401(k). 44.3% invest only in a target date fund. The average IRA balance for baby boomers is $250,966.
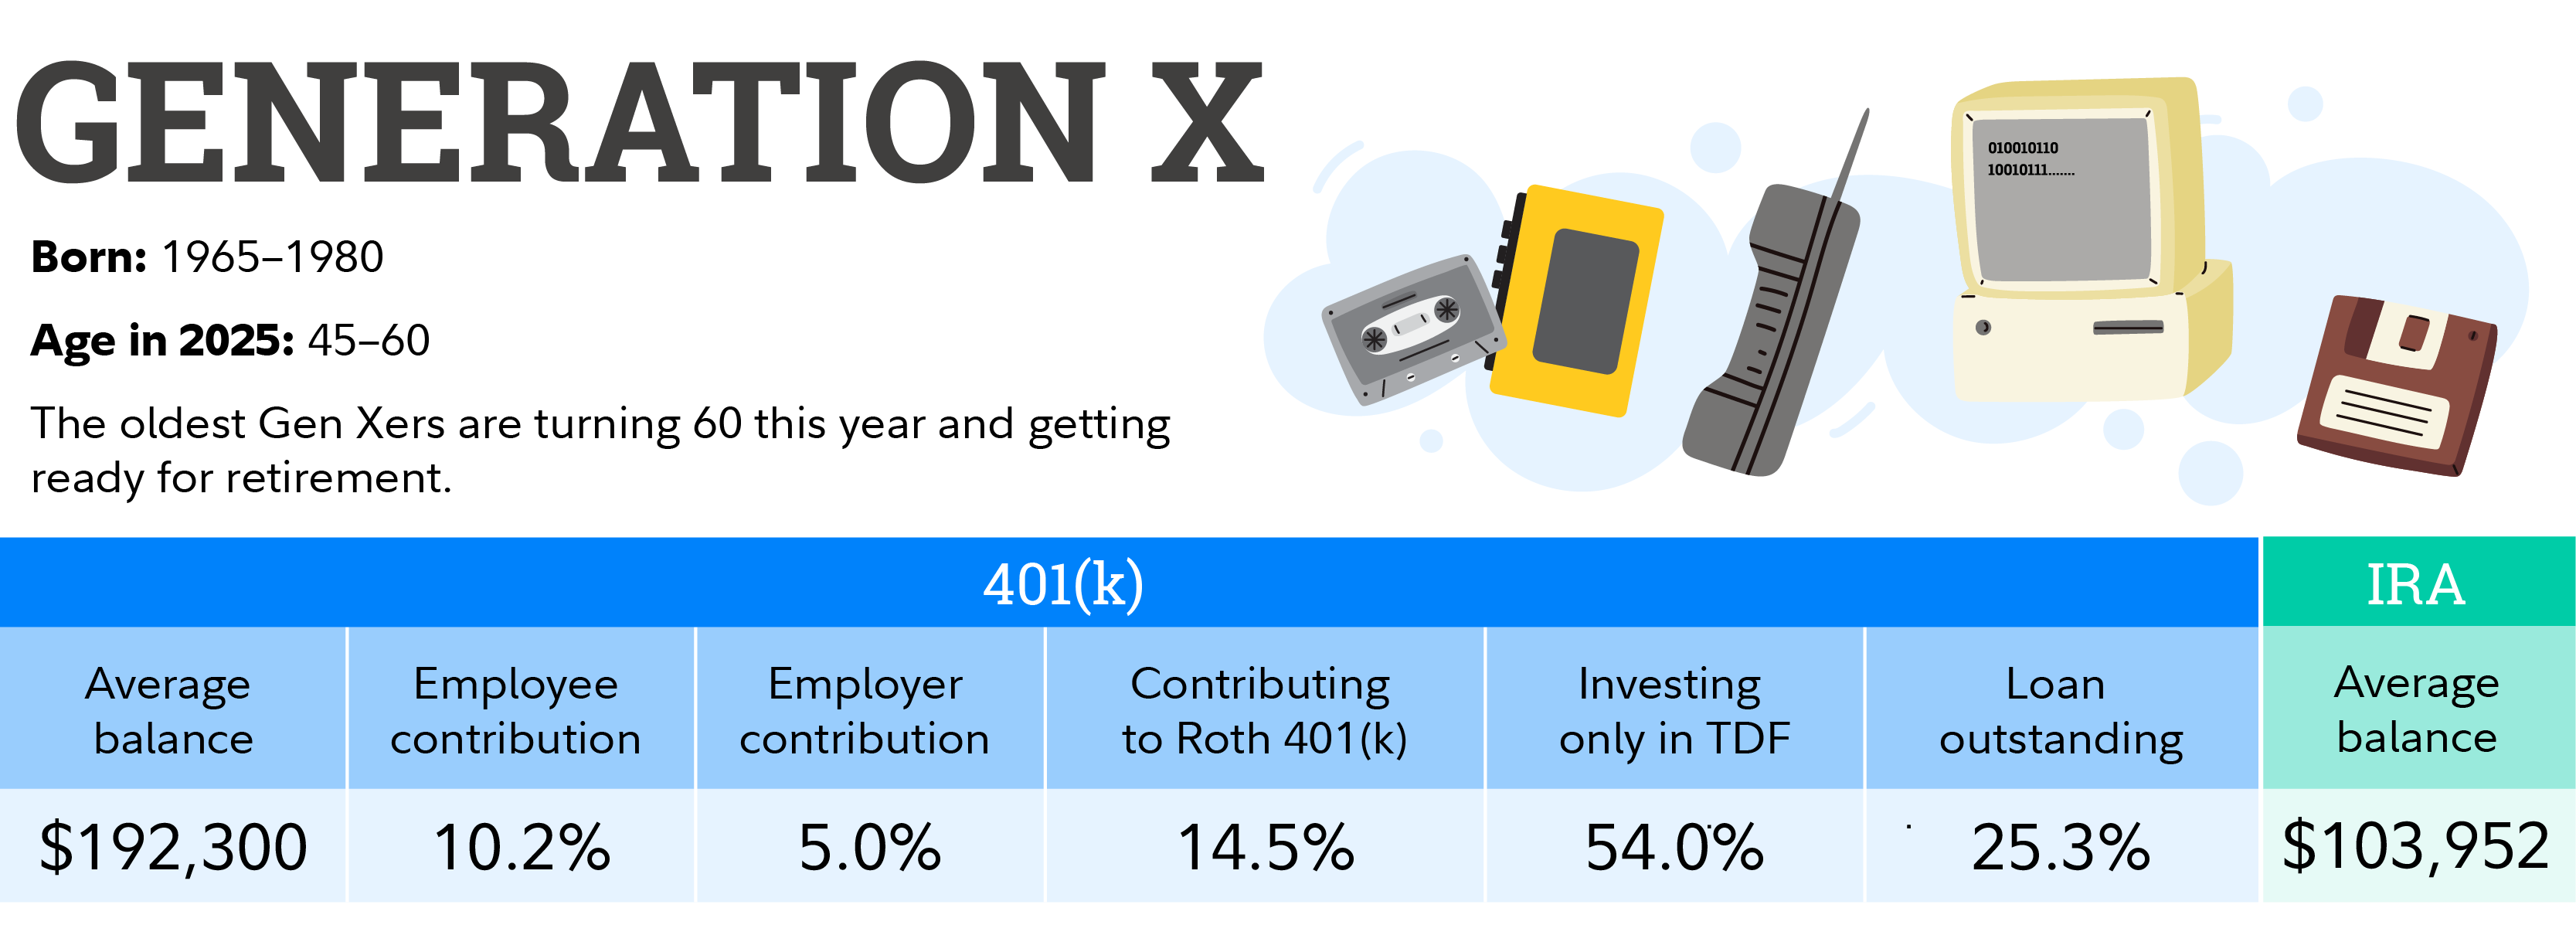
The average 401(k) balance for Gen X is $191,100. The average Gen X employee contribution is 10.2%, the average employer contribution is 5%. 14.1% of employees contribute to a Roth 401(k). 54% invest only in a target date fund. The average IRA balance for Gen X is $100,169.
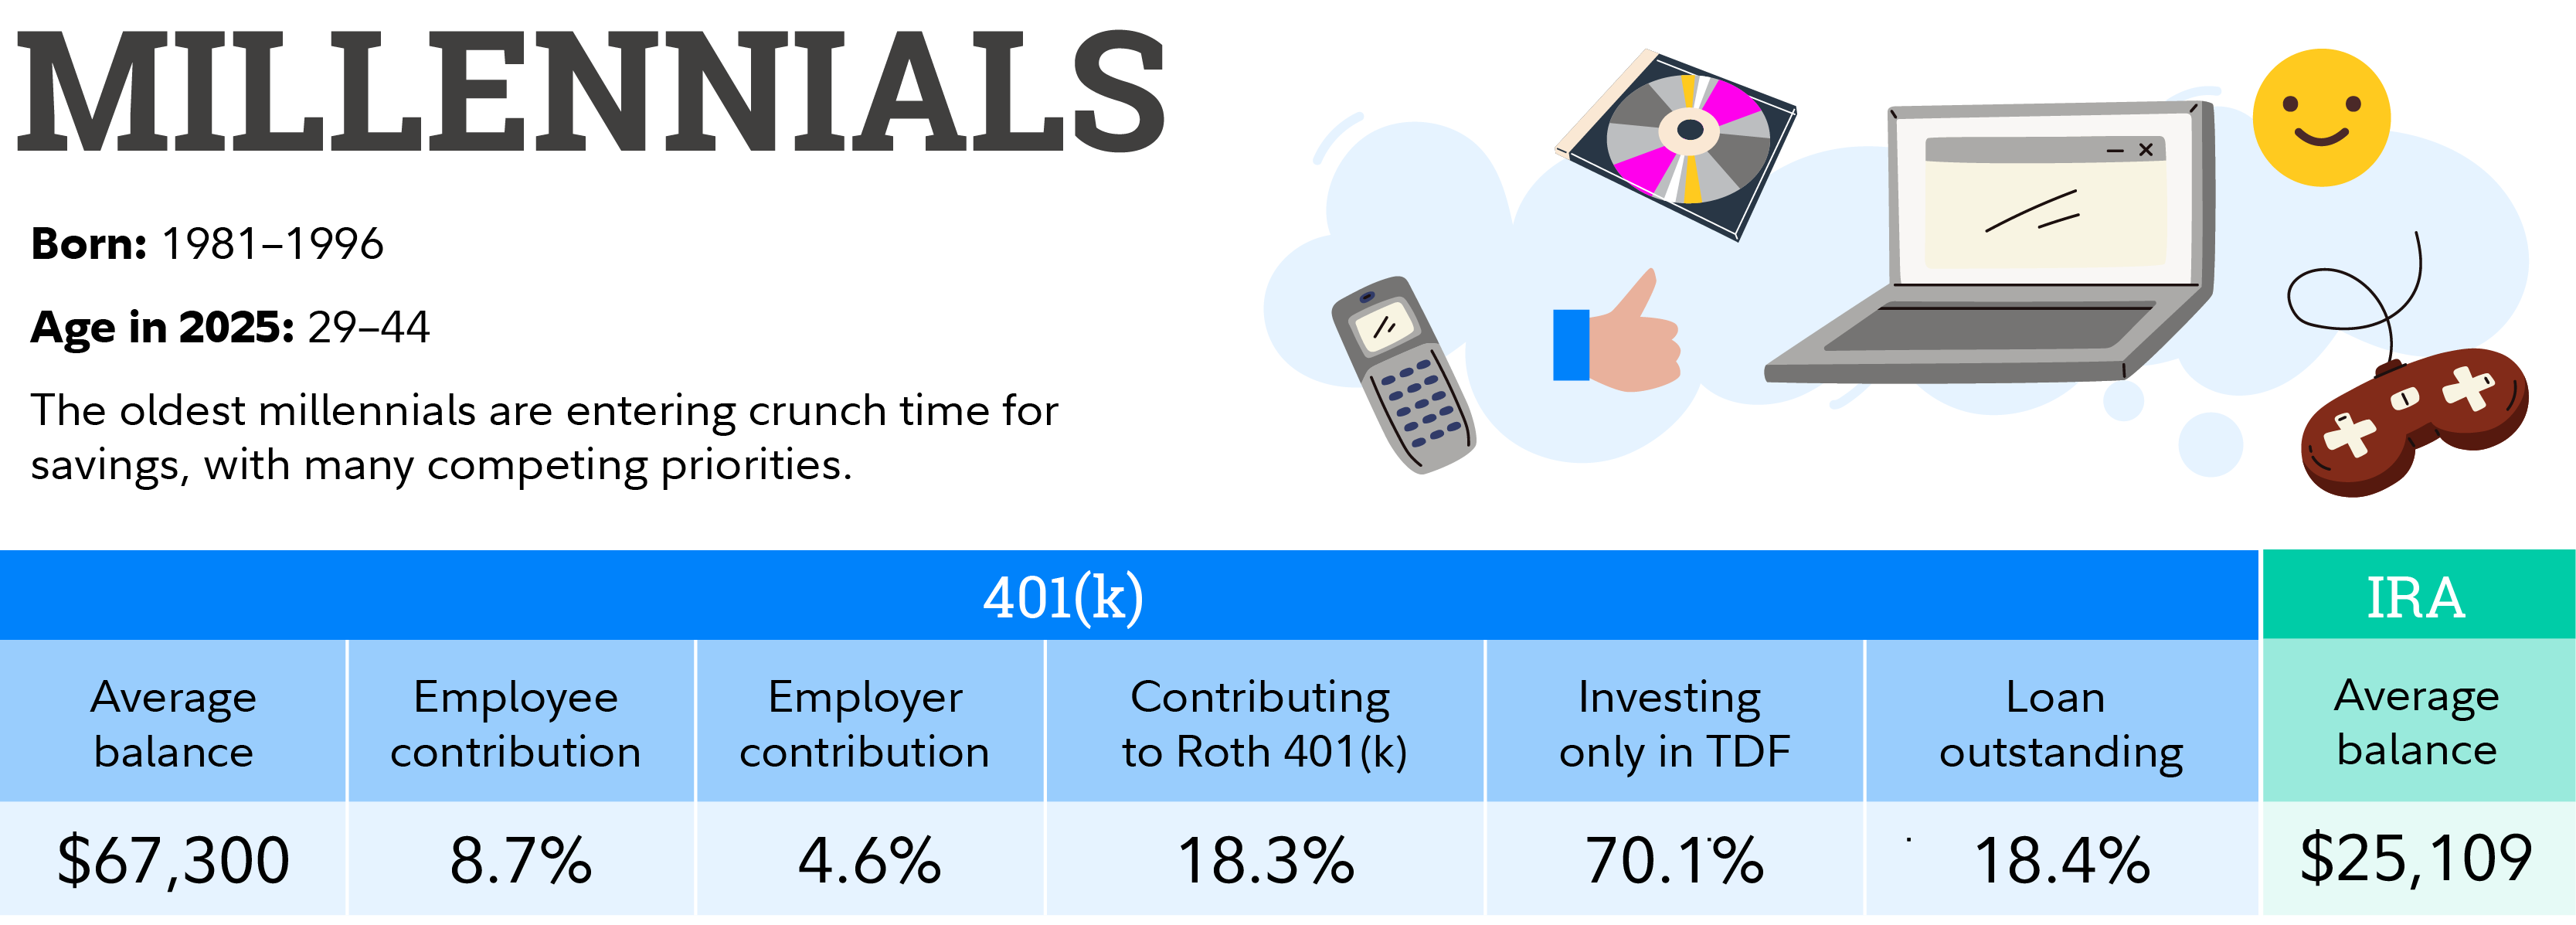
The average 401(k) balance for Millennials is $66,500. The average Millennial employee contribution is 8.6%, the average employer contribution is 4.6%. 18% of employees contribute to a Roth 401(k). 70.4% invest only in a target date fund. The average IRA balance for Millennials is $24,097.
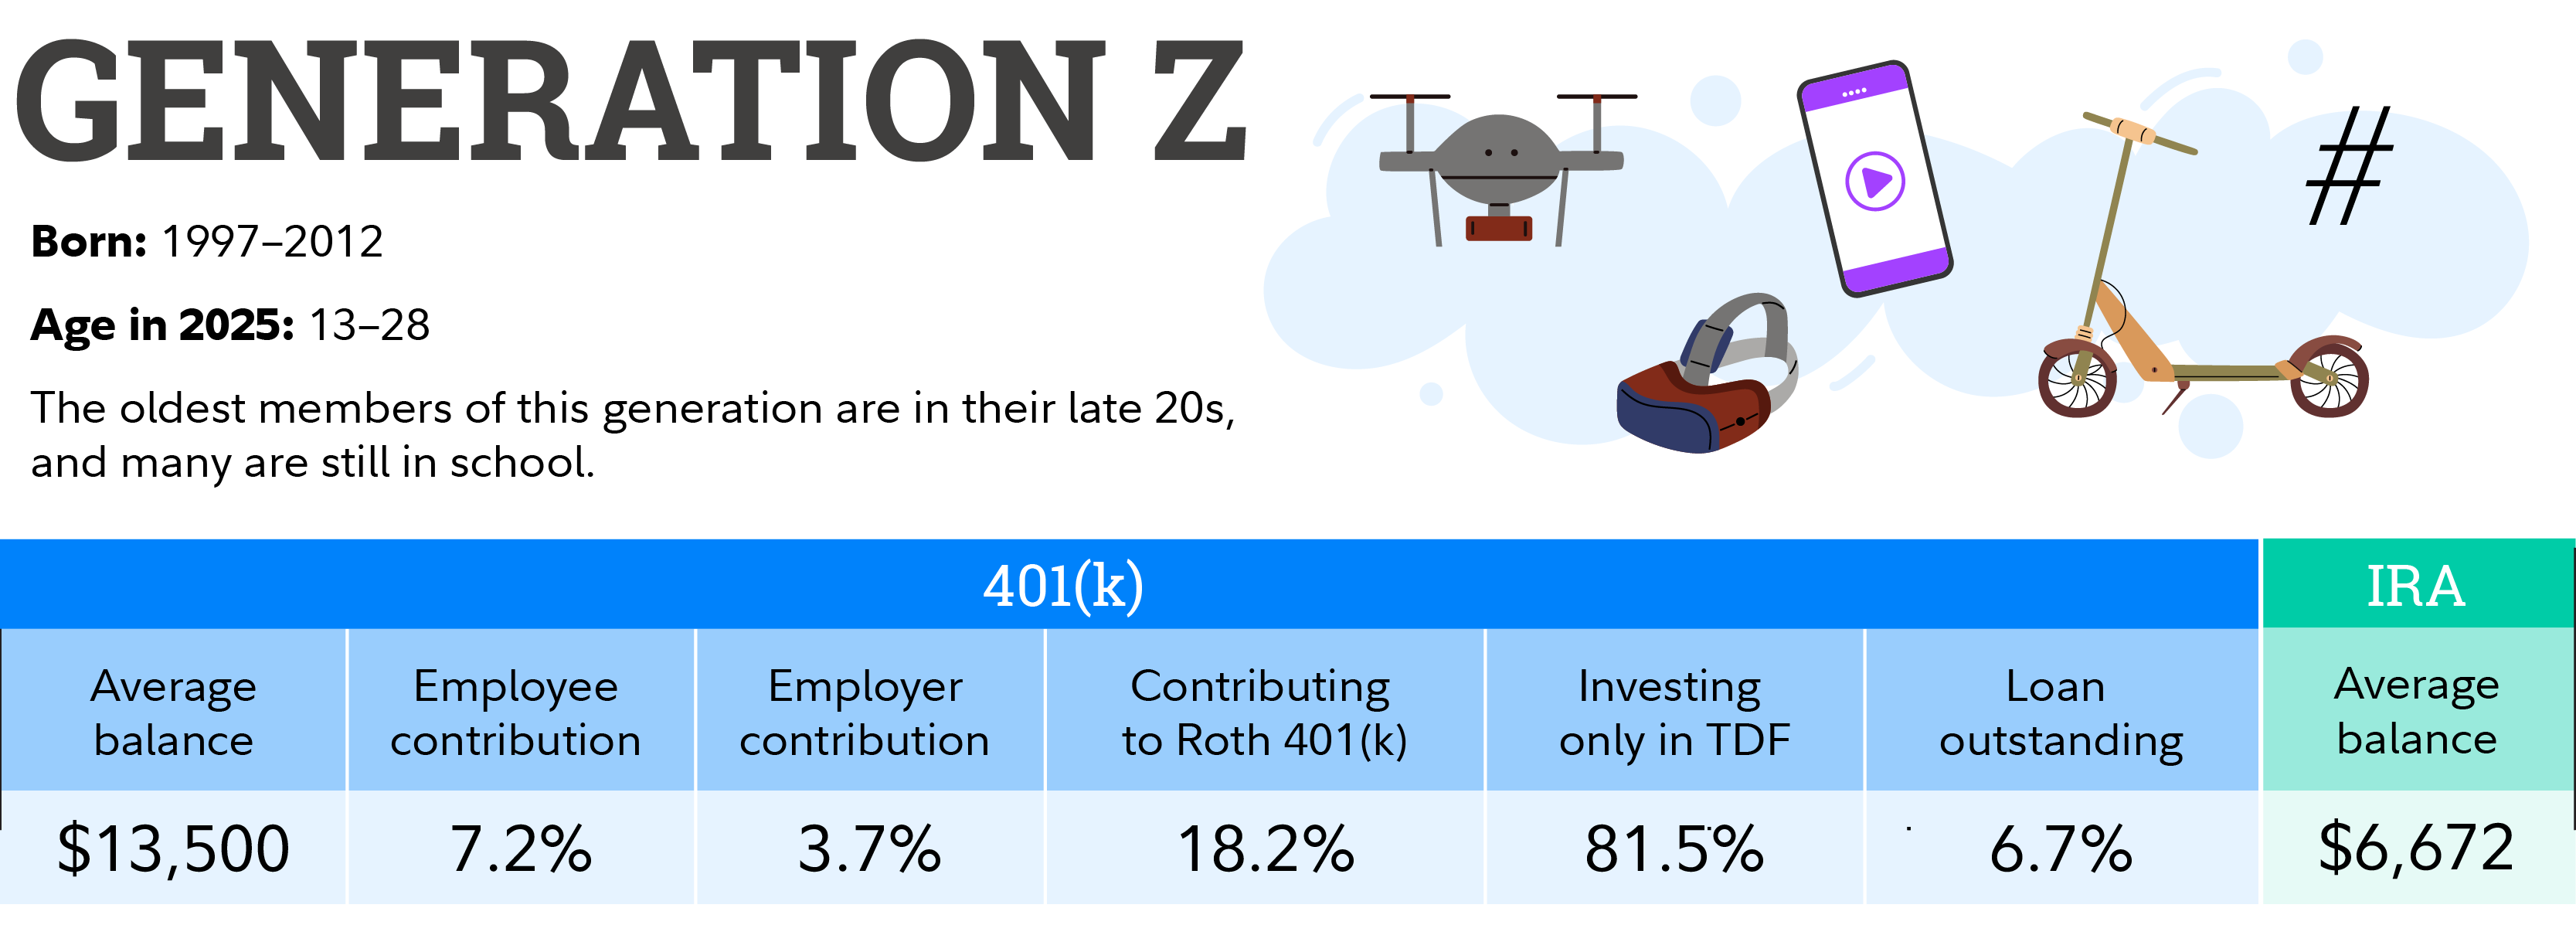
The average 401(k) balance for Gen Z is $13,000. The average Gen Z employee contribution is 7.2%, the average employer contribution is 3.8%. 17.8% of Gen Z employees contribute to a Roth 401(k). 82% invest only in a target date fund. The average IRA balance for Gen Z is $6,479.
Average 401(k) balance Employee contribution Employer contribution Contributing to a Roth 401(k) Investing 100% in target date fund Loan outstanding Average IRA balance
Baby boomers $250,900 11.8% 5.1% 12.0% 44.3% 14.7% $250,966
Gen X $191,900 10.2% 5.0% 14.1% 54.0% 25.1% $100,169
Millennials $66,500 8.6% 4.6% 18.0% 70.4% 18.1% $24,097
Gen Z $13,000 7.2% 3.8% 17.8% 82.0% 6.4% $6,479

Note: TDF stands for target date fund. Source: Fidelity Investments Q3 2024 401(k) data based on 26,400 corporate defined contribution plans and 24.4 million participants as of September 30, 2024. These figures include the advisor-sold market but exclude the tax-exempt market. Excluded from the behavioral statistics are nonqualified defined contribution plans and plans for Fidelity's own employees.

Generations as defined by Pew Research: Baby boomers are individuals born between 1946 and 1964, Gen X are individuals born between 1965 and 1980, millennials include individuals born between 1981 and 1996, and Gen Z includes individuals born between 1997 and 2012. Fidelity business analysis of 15.8 million IRA accounts as of June 30, 2024. Considers only active participants with balance.

The power of consistently investing for retirement

Another way to measure how you are doing is to look at data for people who have been contributing to their workplace retirement plan for years and years. Being in the same plan with the same employer may provide some stability and routine, which may be helpful for saving over a long period of time.
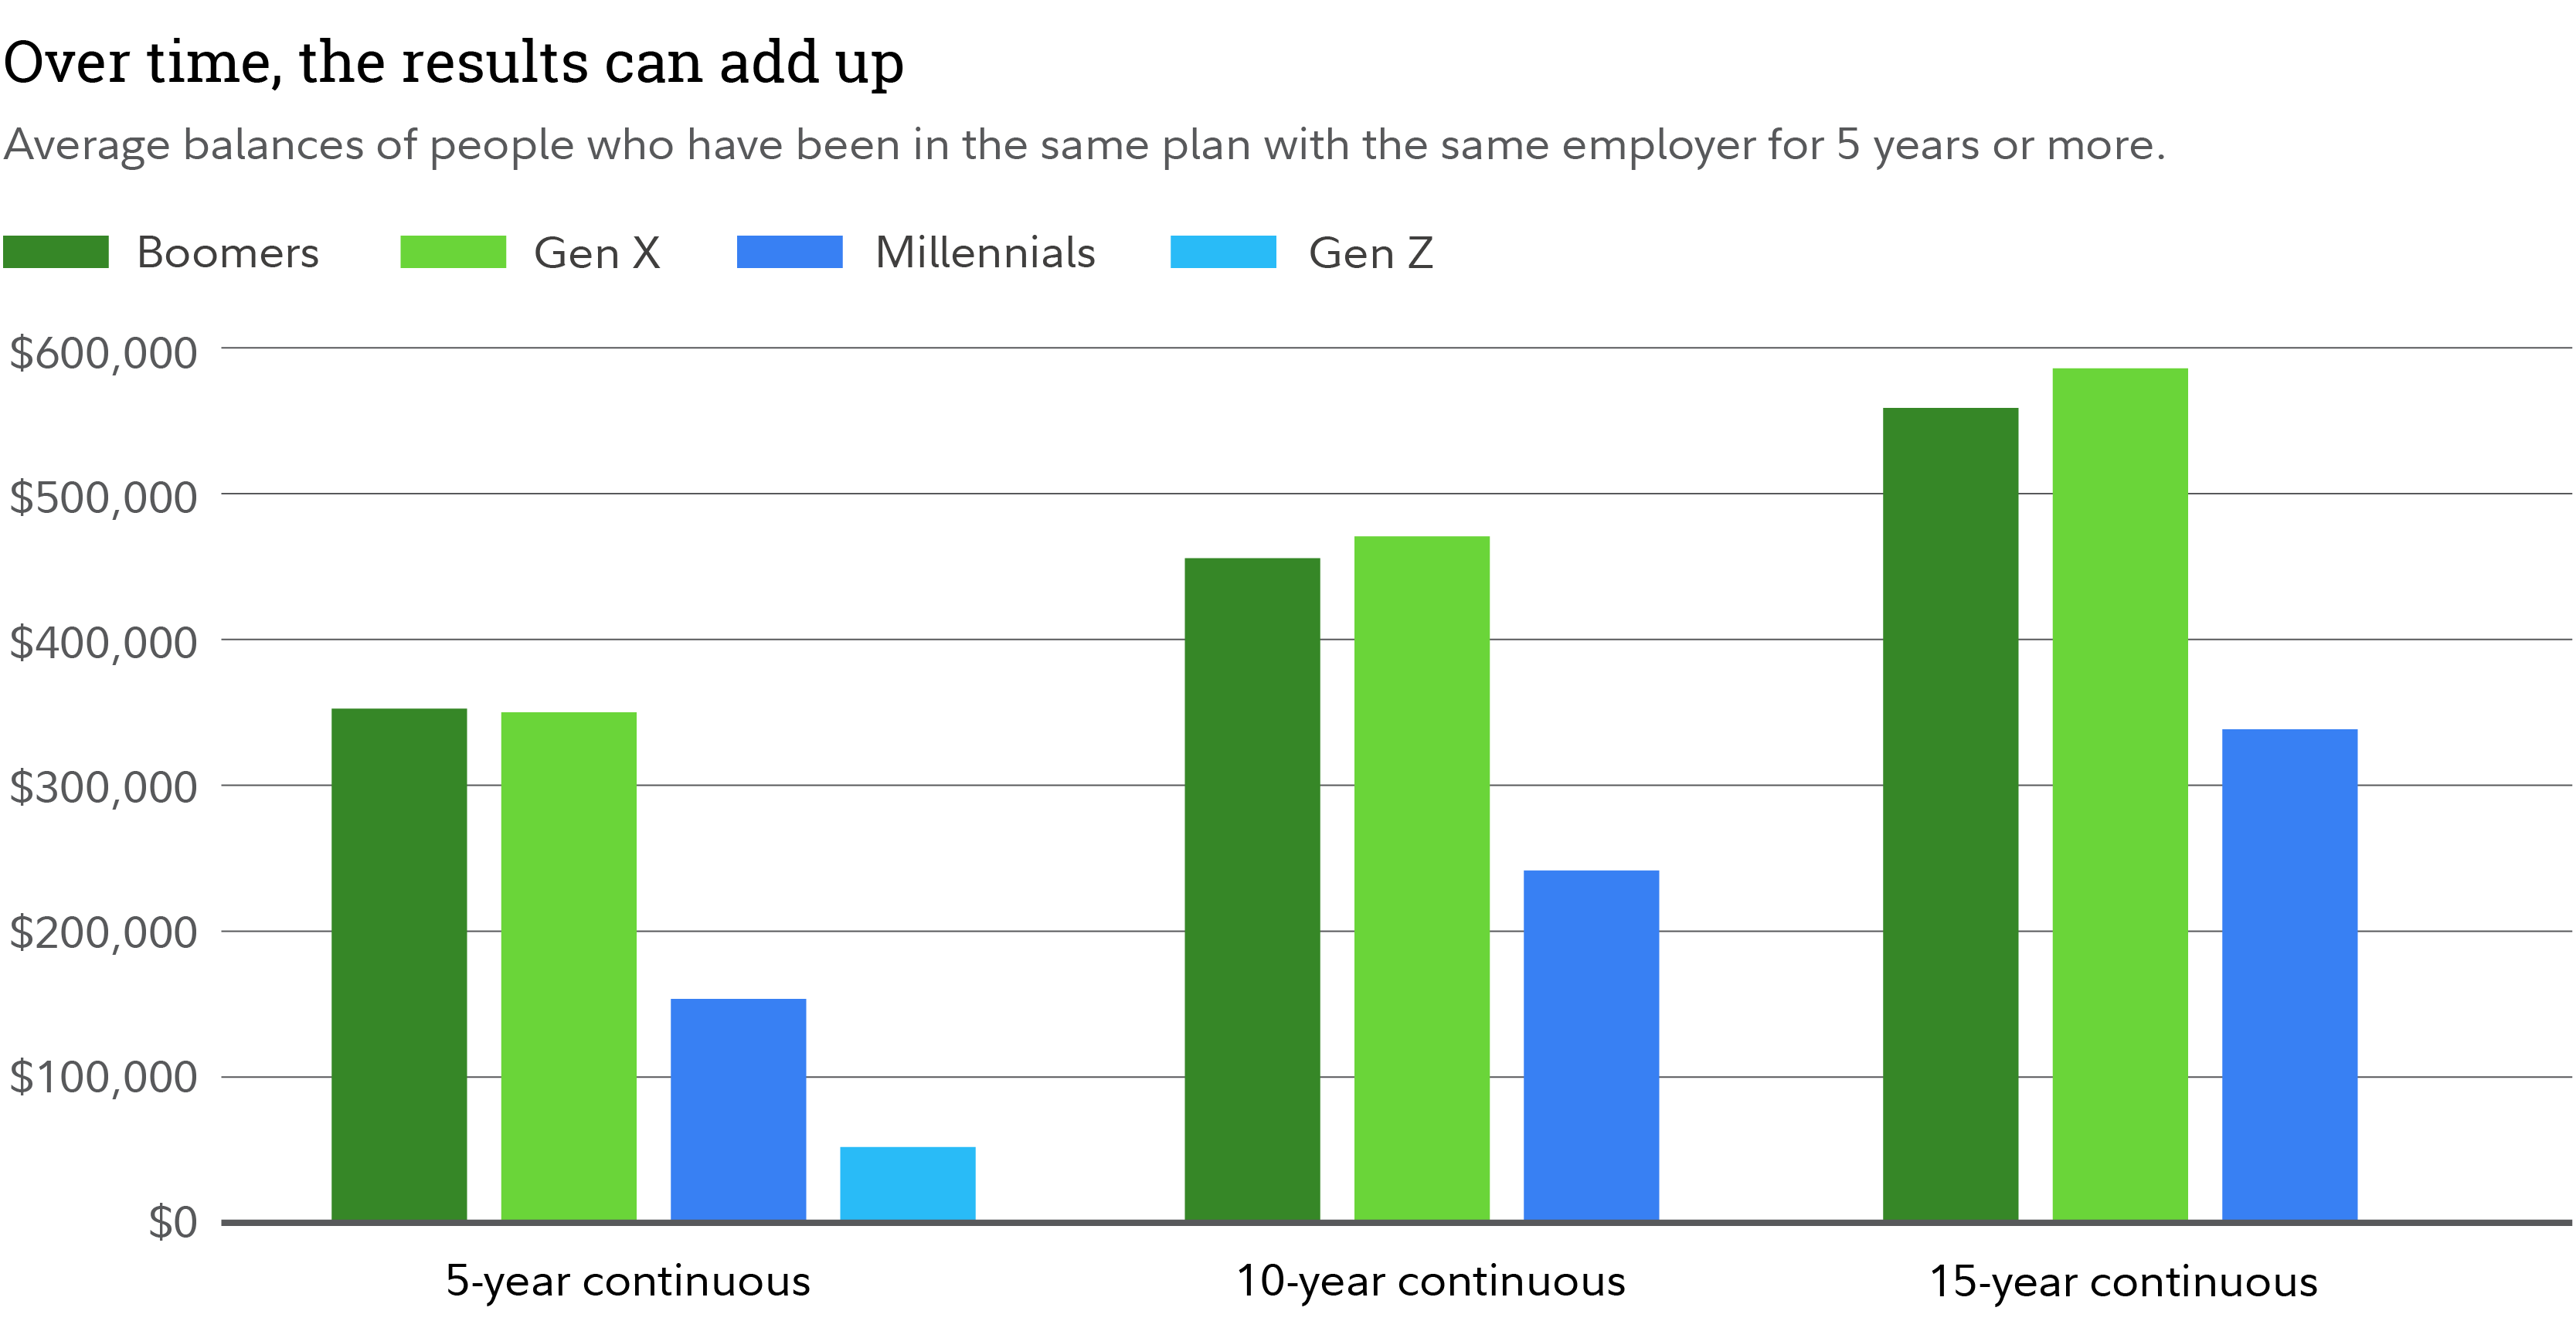
Fidelity Investments Q3 2024 401(k) data based on 26,400 corporate defined contribution plans and 24 million participants as of September 30, 2024. These figures include the advisor-sold market but exclude the tax-exempt market. Excluded from the behavioral statistics are nonqualified defined contribution plans and plans for Fidelity's own employees. Generations as defined by Pew Research: Baby boomers are individuals born between 1946 and 1964, Gen X are individuals born between 1965 and 1980, millennials include individuals born between 1981 and 1996, and Gen Z includes individuals born between 1997 and 2012. Past performance is no guarantee of future results.

To avoid a savings setback when changing jobs, try to ensure that you're able to save at least as much as you were saving at your previous job. If you can't swing it right away, make an appointment with yourself to check your retirement savings rate again in a few months.

How to increase your retirement savings

Don't get discouraged if you feel behind. "Saving for retirement is a marathon, not a sprint," says Mike Shamrell, vice president of thought leadership at Fidelity. He recommends that you keep a long-term focus, especially if your retirement is decades away.

It's important to consider your situation and spending habits. The amount you need to save for your retirement may not be the same as the amount your friends or neighbors should save. It should be based on the age you plan to retire and how you want to live in retirement—frugally or extravagantly for instance.

To see if you're saving enough, Fidelity has a couple of suggestions.

  • Save at least 15% of your pre-tax income every year. This includes the money you put in your 401(k), IRA, and any other accounts meant for retirement. It also includes money you receive from your employer, like through a 401(k) match.
  • Invest for growth potential. Helping your money grow with investments that provide a rate of return above the rate of inflation can help ensure you can maintain your lifestyle in retirement. A diversified, age-appropriate mix of investments could help you reach your goals more quickly and easily than investing in cash or very safe investments.
  • Aim to save 10 times your income by age 67. If you plan to retire earlier, you may need to save a higher multiple of income (for instance 12 times your income).
  • Get your savings factors: Answer 3 simple questions to find out how much of your salary to consider saving by specific ages.
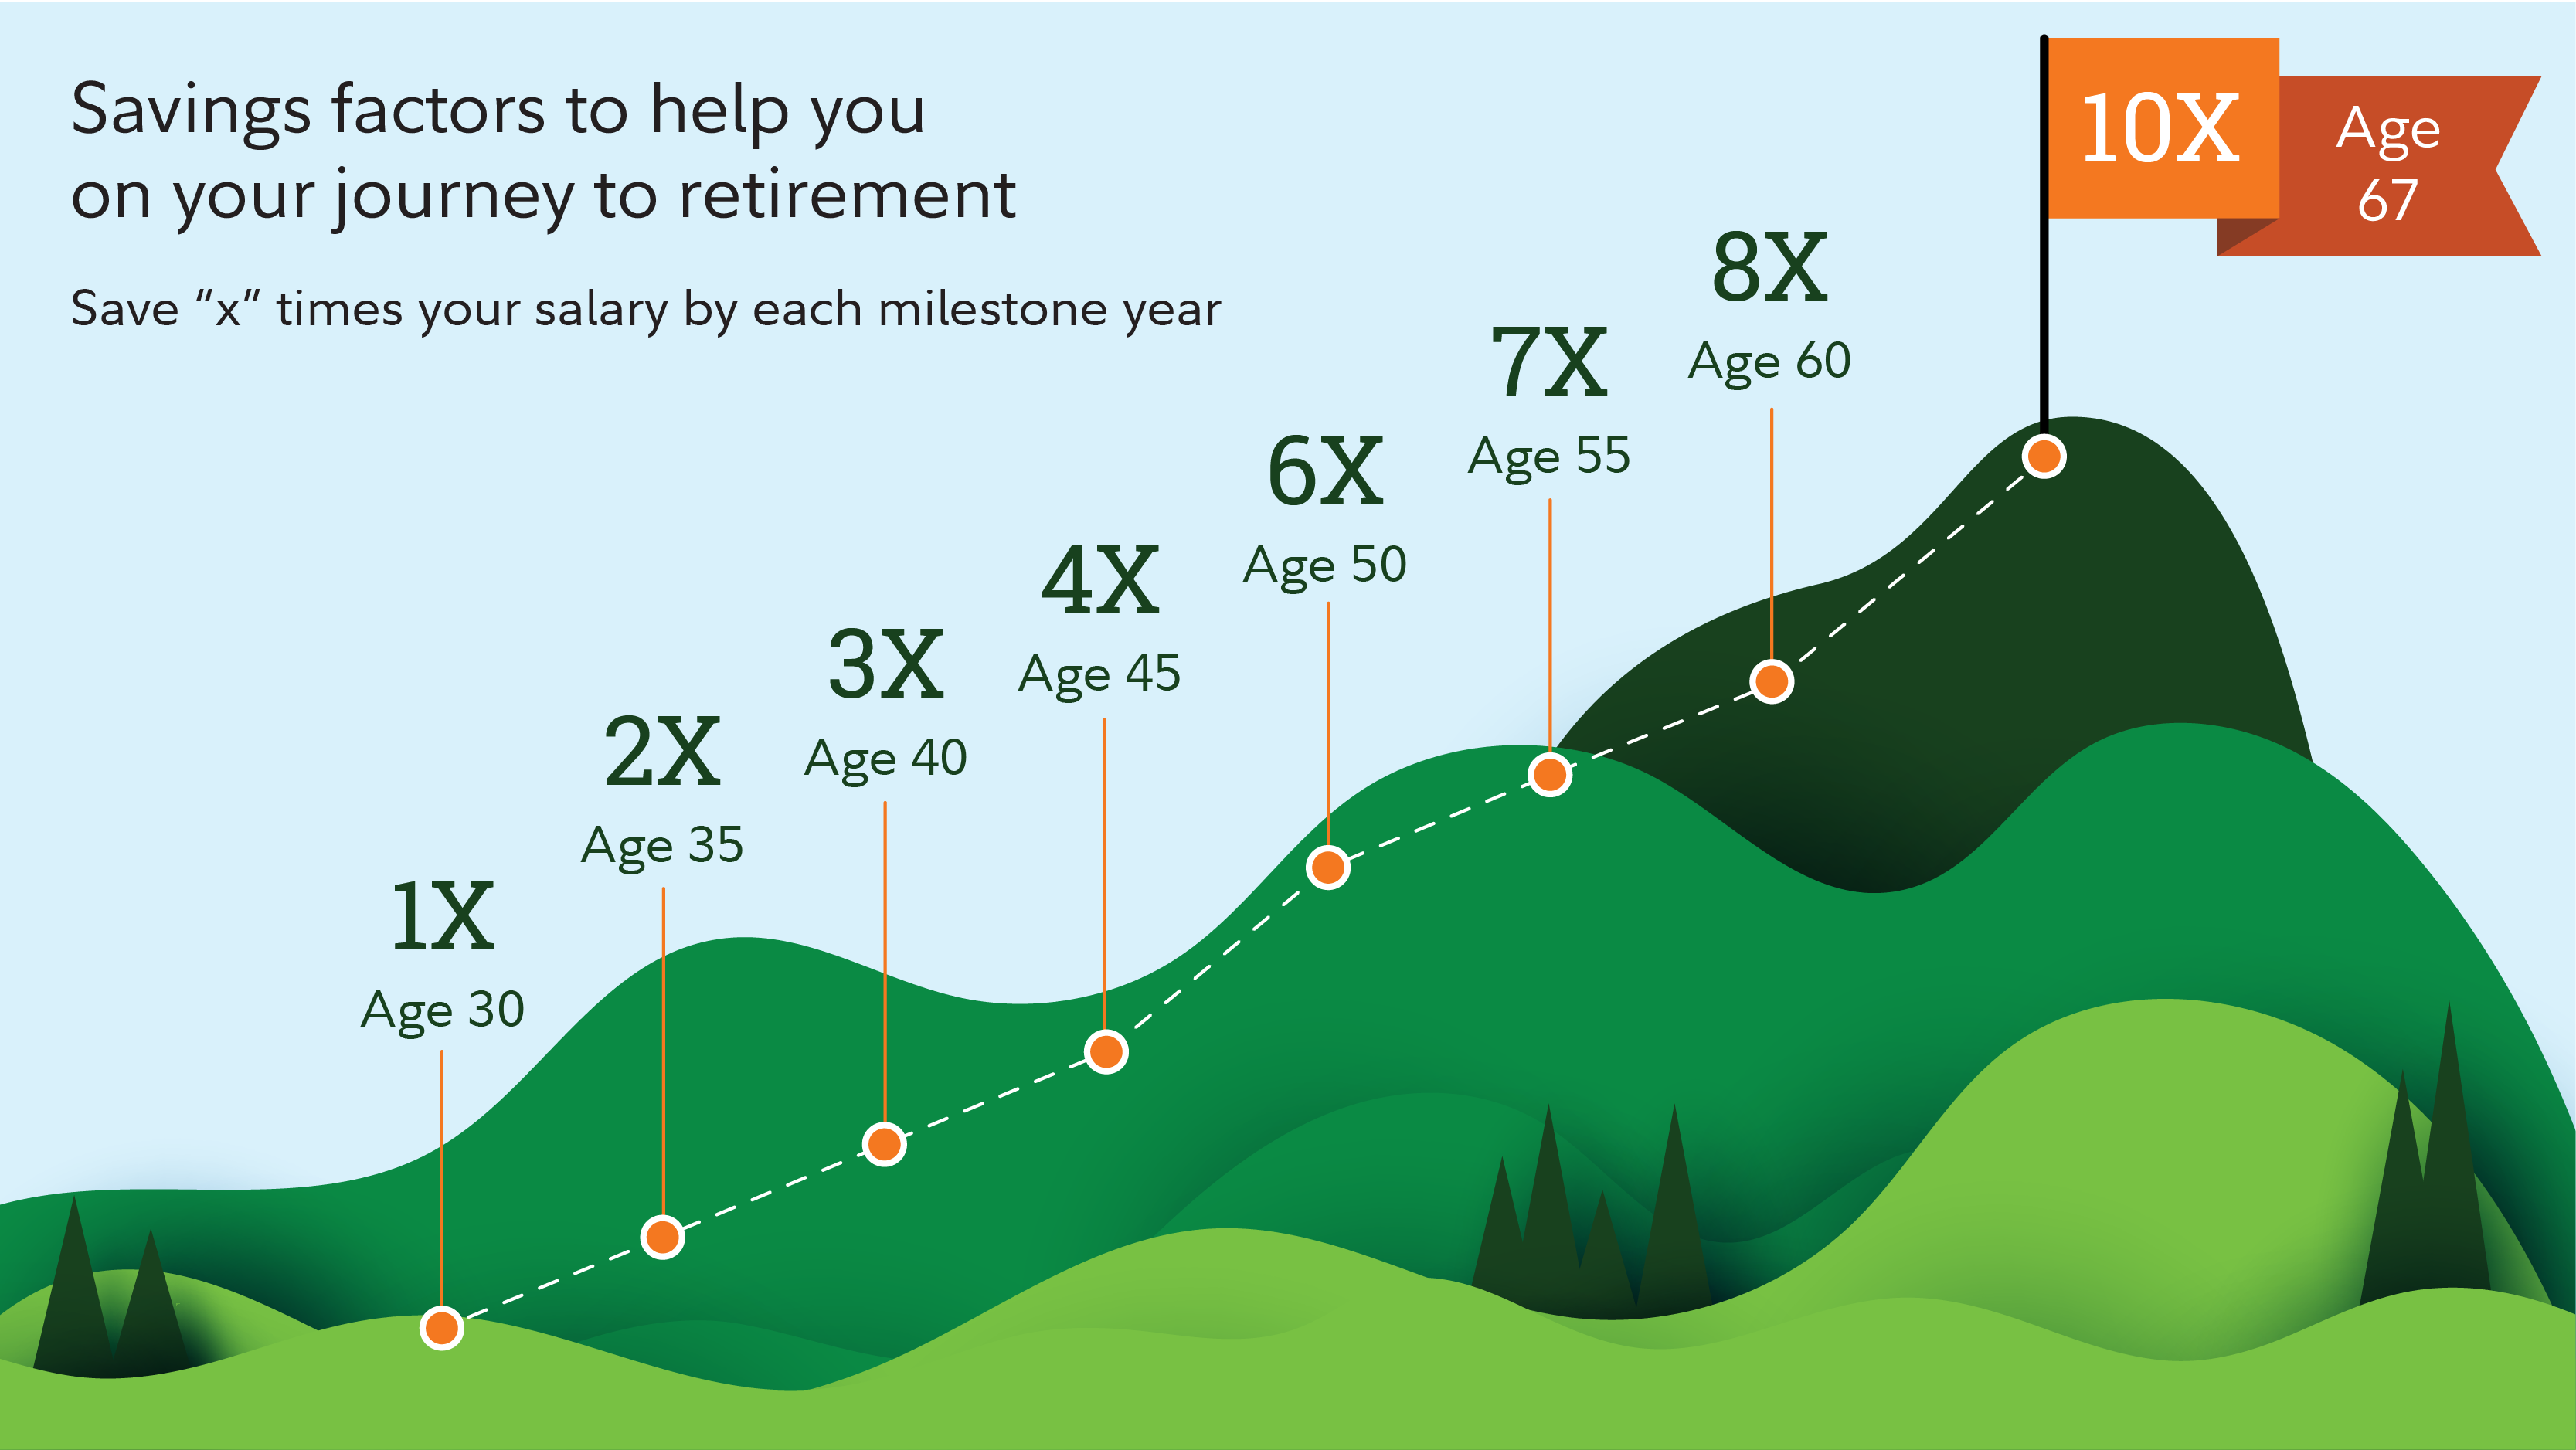
Fidelity has developed a series of salary multipliers in order to provide participants with one measure of how their current retirement savings might be compared to potential income needs in retirement. The salary multiplier suggested is based solely on your current age. In developing the series of salary multipliers corresponding to age, Fidelity assumed age-based asset allocations consistent with the equity glide path of a typical target date retirement fund, a 15% savings rate, a 1.5% constant real wage growth, a retirement age of 67 and a planning age through 93. The replacement annual income target is defined as 45% of pre-retirement annual income and assumes no pension income. This target is based on Consumer Expenditure Survey (BLS), Statistics of Income Tax Stat, IRS tax brackets and Social Security Benefit Calculators. Fidelity developed the salary multipliers through multiple market simulations based on historical market data, assuming poor market conditions to support a 90% confidence level of success. These simulations take into account the volatility that a typical target date asset allocation might experience under different market conditions. Volatility of the stocks, bonds and short-term asset classes is based on the historical annual data from 1926 through the most recent year-end data available from Ibbotson Associates, Inc. Stocks (domestic and foreign) are represented by Ibbotson Associates SBBI S&P 500 Total Return Index, bonds are represented by Ibbotson Associates SBBI U.S. Intermediate Term Government Bonds Total Return Index, and short term are represented by Ibbotson Associates SBBI 30-day U.S. Treasury Bills Total Return Index, respectively. It is not possible to invest directly in an index. All indices include reinvestment of dividends and interest income. All calculations are purely hypothetical and a suggested salary multiplier is not a guarantee of future results; it does not reflect the return of any particular investment or take into consideration the composition of a participant's particular account. The salary multiplier is intended only to be one source of information that may help you assess your retirement income needs. Remember, past performance is no guarantee of future results. Performance returns for actual investments will generally be reduced by fees or expenses not reflected in these hypothetical calculations. Returns also will generally be reduced by taxes.
  • Weigh saving in a 401(k) and an IRA: After contributing enough to get any available 401(k) match, consider whether you'd like to save more through your 401(k) or an IRA. Both accounts have advantages. For example, an IRA may offer more investment variety whereas a 401(k) lets you save more per year and doesn't have income restrictions. Fidelity generally recommends prioritizing a 401(k) because of the potential for an employer match. Read Fidelity Smart Money: IRA vs. 401(k): What's the difference?
  • Keep increasing your savings rate when possible: Any extra money you can put aside per year will improve your retirement prospects. Once you turn 50 you can add more per year with catch-up contributions.

Finally, the Fidelity figures are just guidelines, not the only measure of success. If you don't end up with 10 times your salary by age 67, having some money saved, whether it's 8 times your salary, 4 or 1, is better than none.

Ready to open a retirement account?

Opening a new account takes just minutes.

More to explore

This information is intended to be educational and is not tailored to the investment needs of any specific investor.

Fidelity has developed a series of salary multipliers in order to provide participants with one measure of how their current retirement savings might be compared to potential income needs in retirement. The salary multiplier suggested is based solely on your current age. In developing the series of salary multipliers corresponding to age, Fidelity assumed age-based asset allocations consistent with the equity glide path of a typical target date retirement fund, a 15% savings rate, a 1.5% constant real wage growth, a retirement age of 67 and a planning age through 93. The replacement annual income target is defined as 45% of pre-retirement annual income and assumes no pension income. This target is based on Consumer Expenditure Survey (BLS), Statistics of Income Tax Stat, IRS tax brackets and Social Security Benefit Calculators. Fidelity developed the salary multipliers through multiple market simulations based on historical market data, assuming poor market conditions to support a 90% confidence level of success.

These simulations take into account the volatility that a typical target date asset allocation might experience under different market conditions. Volatility of the stocks, bonds and short-term asset classes is based on the historical annual data from 1926 through the most recent year-end data available from Ibbotson Associates, Inc. Stocks (domestic and foreign) are represented by Ibbotson Associates SBBI S&P 500 Total Return Index, bonds are represented by Ibbotson Associates SBBI U.S. Intermediate Term Government Bonds Total Return Index, and short term are represented by Ibbotson Associates SBBI 30-day U.S. Treasury Bills Total Return Index, respectively. It is not possible to invest directly in an index. All indices include reinvestment of dividends and interest income. All calculations are purely hypothetical and a suggested salary multiplier is not a guarantee of future results; it does not reflect the return of any particular investment or take into consideration the composition of a participant’s particular account. The salary multiplier is intended only to be one source of information that may help you assess your retirement income needs. Remember, past performance is no guarantee of future results. Performance returns for actual investments will generally be reduced by fees or expenses not reflected in these hypothetical calculations. Returns also will generally be reduced by taxes.

Views expressed are as of the date indicated, based on the information available at that time, and may change based on market or other conditions. Unless otherwise noted, the opinions provided are those of the speaker or author and not necessarily those of Fidelity Investments or its affiliates. Fidelity does not assume any duty to update any of the information.

Fidelity does not provide legal or tax advice. The information herein is general in nature and should not be considered legal or tax advice. Consult an attorney or tax professional regarding your specific situation.

Past performance is no guarantee of future results.

Investing involves risk, including risk of loss.

Fidelity Brokerage Services LLC, Member NYSE, SIPC, 900 Salem Street, Smithfield, RI 02917

1179344.1.0