There is a common perception among many investors that bonds represent the safer part of a balanced portfolio and are less risky than stocks. While bonds have historically been less volatile than stocks over the long term, they are not without risk.
The most common and most easily understood risk associated with bonds is credit risk. Credit risk refers to the possibility that the company or government entity that issued a bond will default and be unable to pay back investors' principal or make interest payments.
Bonds issued by the US government generally have low credit risk. However, Treasury bonds (as well as other types of fixed income investments) are sensitive to interest rate risk, which refers to the possibility that a rise in interest rates will cause the value of the bonds to decline. Bond prices and interest rates move in opposite directions, so when interest rates fall, the value of fixed income investments rises, and when interest rates go up, bond prices fall in value.
If rates rise and you sell your bond prior to its maturity date (the date on which your investment principal is scheduled to be returned to you), you could end up receiving less than what you paid for your bond. Similarly, if you own a bond fund or bond exchange-traded fund (ETF), its net asset value will decline if interest rates rise. The degree to which values will fluctuate depends on several factors, including the maturity date and coupon rate on the bond or the bonds held by the fund or ETF.
Using a bond's duration to gauge interest rate risk
While no one can predict the future direction of interest rates, examining the "duration" of each bond, bond fund, or bond ETF you own provides a good estimate of how sensitive your fixed income holdings are to a potential change in interest rates. Investment professionals rely on duration because it rolls up several bond characteristics (such as maturity date, coupon payments, etc.) into a single number that gives a good indication of how sensitive a bond's price is to interest rate changes. For example, if rates were to rise 1%, a bond or bond fund with a 5-year average duration would likely lose approximately 5% of its value.
Duration is expressed in terms of years, but it is not the same thing as a bond's maturity date. That said, the maturity date of a bond is one of the key components in figuring duration, as is the bond's coupon rate. In the case of a zero-coupon bond, the bond's remaining time to its maturity date is equal to its duration. When a coupon is added to the bond, however, the bond's duration number will always be less than the maturity date. The larger the coupon, the shorter the duration number becomes.
Generally, bonds with long maturities and low coupons have the longest durations. These bonds are more sensitive to a change in market interest rates and thus are more volatile in a changing rate environment. Conversely, bonds with shorter maturity dates or higher coupons will have shorter durations. Bonds with shorter durations are less sensitive to changing rates and thus are less volatile in a changing rate environment.
The chart below shows how a bond with a 5% annual coupon that matures in 10 years (green bar) would have a longer duration and would fall more in price as interest rates rise than a bond with a 5% coupon that matures in 6 months (blue bar). Why is this so? Because bonds with shorter maturities return investors' principal more quickly than long-term bonds do. Therefore, they carry less long-term risk because the principal is returned, and can be reinvested, earlier.

*A simultaneous change in interest rates across the bond yield curve. This hypothetical example is an approximation that ignores the impact of convexity; we assume the duration for the 6-month bonds and 10-year bonds in this example to be 0.38 and 8.87, respectively. Duration measures the percentage change in price with respect to a change in yield.
Source: FMRCo
Of course, duration works both ways. If interest rates were to fall, the value of a bond with a longer duration would rise more than a bond with a shorter duration. Therefore, in our example above, if interest rates were to fall by 1%, the 10-year bond with a duration of just under 9 years would rise in value by approximately 9%. If rates were to fall 2%, the bond’s value would also rise by approximately twice as much (18%).
Using a bond's convexity to gauge interest rate risk
Keep in mind that while duration may provide a good estimate of the potential price impact of small and sudden changes in interest rates, it may be less effective for assessing the impact of large changes in rates. This is because the relationship between bond prices and bond yields is not linear but convex—it follows the line "Yield 2" in the diagram below.
Using the illustrative chart, you can see how when yields are low, a 1% increase in rates will lead to a larger change in a bond’s price than when beginning yields are high. This differential between the linear duration measure and the actual price change is a measure of convexity—shown in the diagram as the space between the blue line (Yield 1) and the red line (Yield 2).

For illustrative purposes only. Source: FMRCo
The impact of convexity is also more pronounced in long-duration bonds with small coupons—something known as "positive convexity," meaning it will act to reinforce or magnify the price volatility measure indicated by duration as discussed earlier.
Keep in mind that duration is just one consideration when assessing risks related to your fixed income portfolio. Credit risk, inflation risk, liquidity risk, and call risk are other relevant variables that should be part of your overall analysis and research when choosing your investments.
Viewing and using duration data on Fidelity.com
Log in to your Fidelity account to get specific bond data using the tools and features outlined below.
Managing the duration of your portfolio
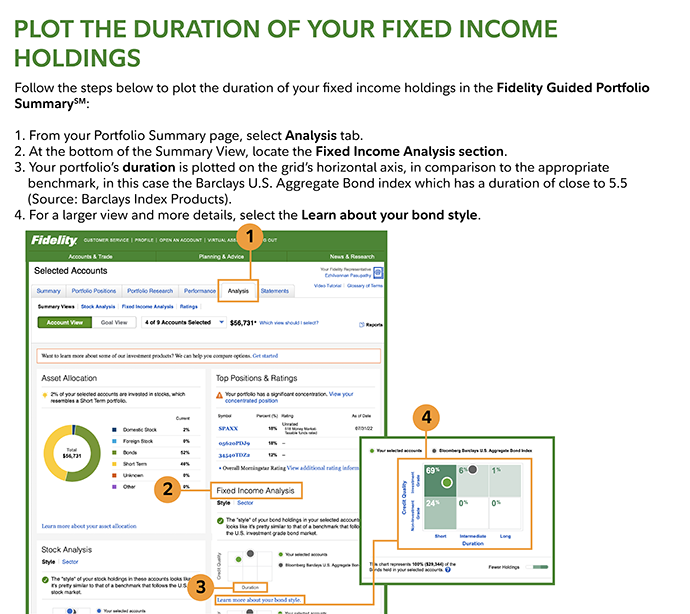
Plot the duration of your fixed income holdings using Fidelity's Performance & Analysis experience to see at a glance the weighted average duration of your fixed income holdings at Fidelity. The duration of your fixed income investments is also plotted on a grid in comparison to the benchmark.
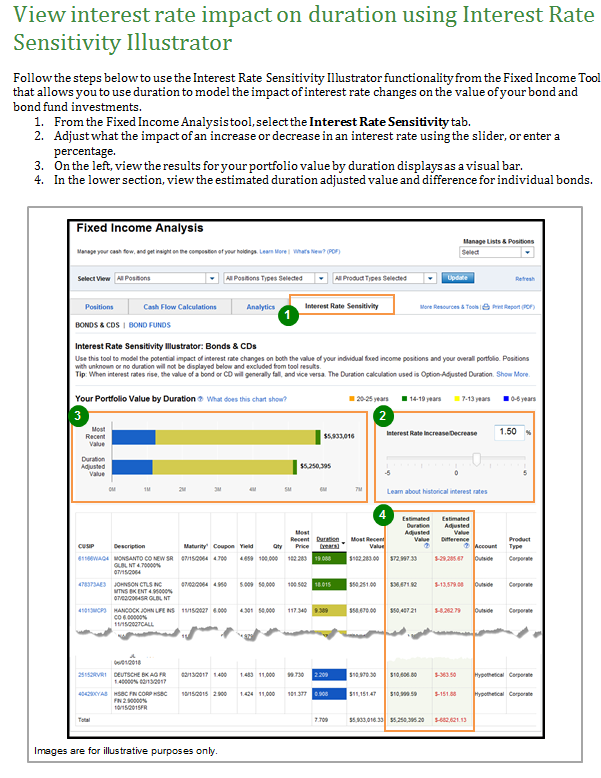
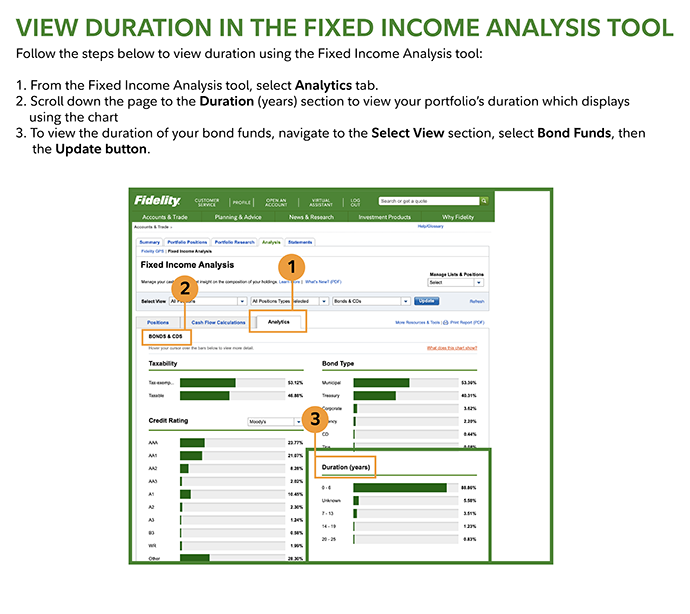
View duration in the Fixed Income Analysis tool to see the duration of your bonds, CDs, and bond funds. Also, model the hypothetical addition to your portfolio of new bonds to see how they might impact the duration of the overall portfolio.
Accessing the duration of an individual investment
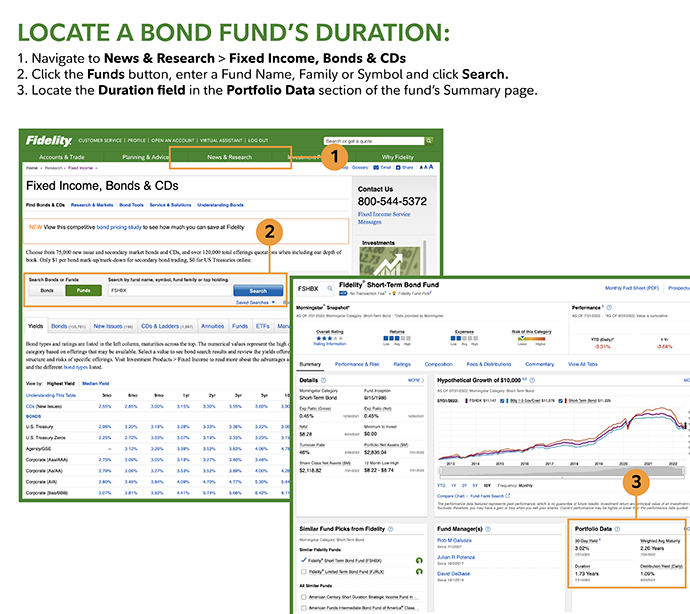
Locate a bond fund's duration in the bond fund's online profile under Portfolio Data.
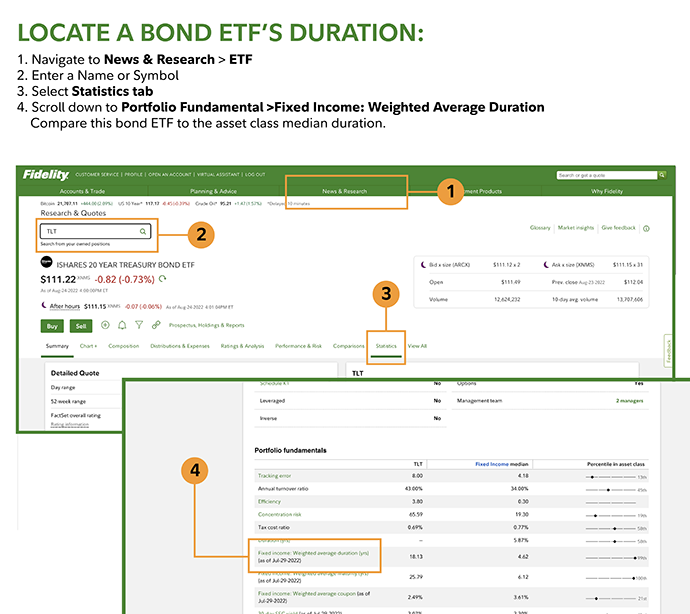
Locate a bond ETF's duration from either the Snapshot page or Key Statistics, where the duration of the specific ETF can be compared to the asset class median duration.
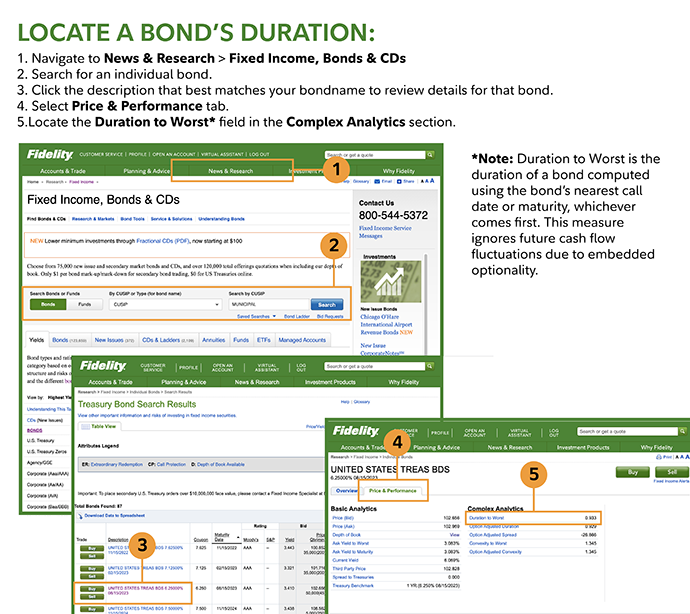
Locate a bond's duration under each bond's Bond Details page.
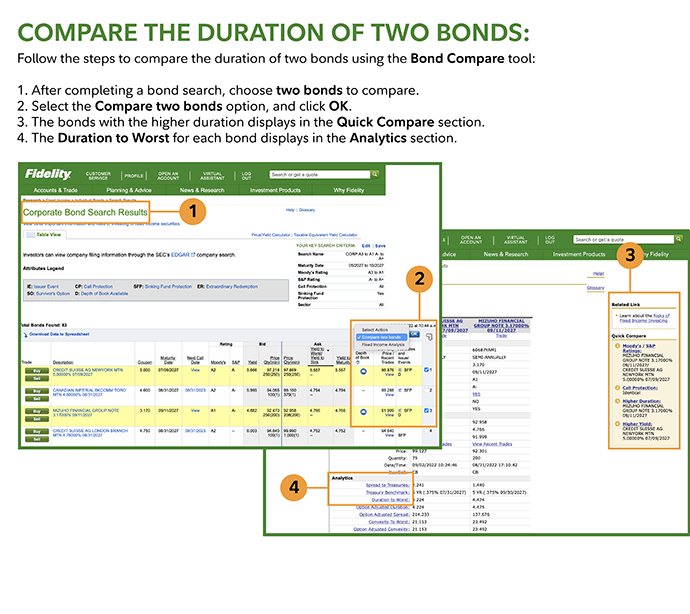
Compare the duration of two bonds. As you review potential bond investments, you can easily compare duration and other characteristics between two bonds using this tool.


