Principles of InvestingFidelity's Investment Management Principles
|
We believe there are 3 principles that people should consider when developing and maintaining an investment strategy. While the way you invest can be adjusted over time as your goals or circumstances change, these principles can be applied to virtually any goal. We can help you better understand these investment management principles and what it takes to apply them to your own financial life.
Choosing an asset allocation is just the beginning. You also have to maintain it, making adjustments as markets shift and your personal financial situation changes. This is an ongoing, multi-step process involving not just watching the economy, the markets, and your investments, but taking action when necessary.
Rebalancing, or periodically adjusting the mix of stocks, bonds, and short-term investments in your portfolio to make sure your asset allocation continues to reflect your feelings about risk and your goals, in an important part of maintaining your portfolio. You'll want to conduct ongoing reviews of your personal and financial situation to determine if anything’s changed and whether those changes warrant adjusting your investments.
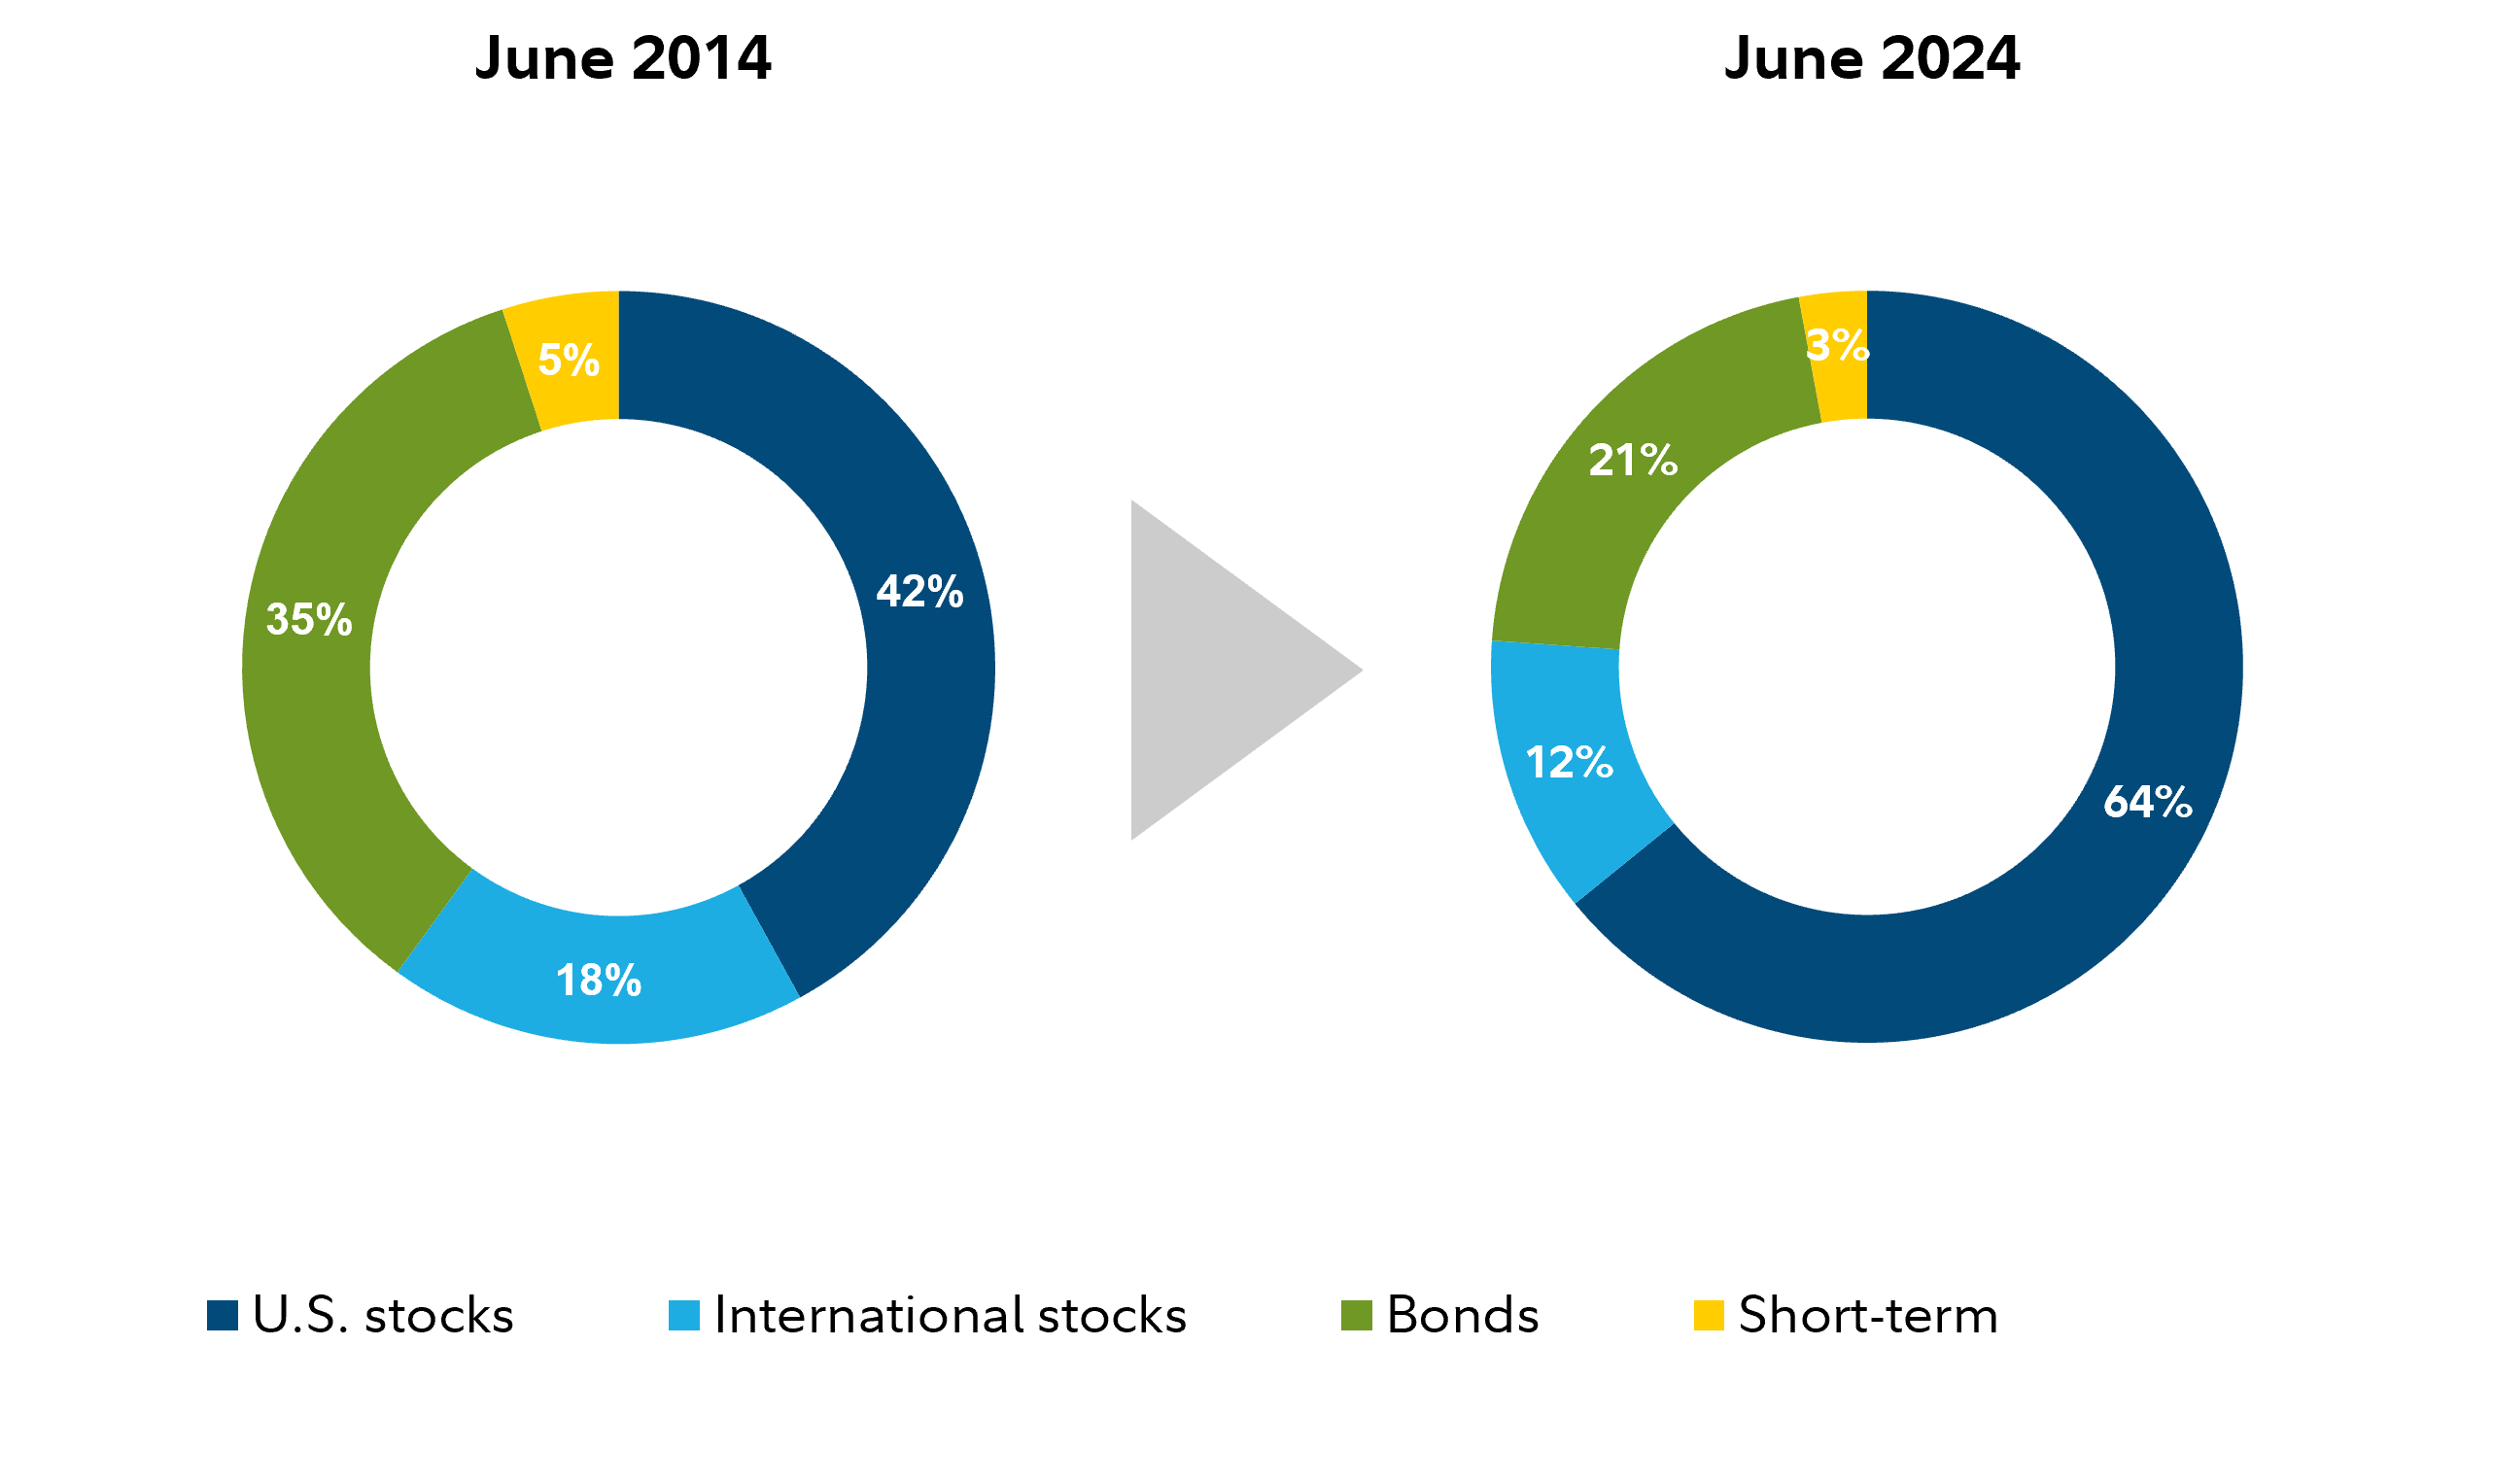
To understand the importance of rebalancing, look at the hypothetical portfolio below. Between June 30, 2014 and June 30, 2024, the portfolio was left to "drift,' with no rebalancing taking place. Note how over that time, as stocks outperformed bonds, the original asset allocation changed significantly.
Increased risk as stock markets rise
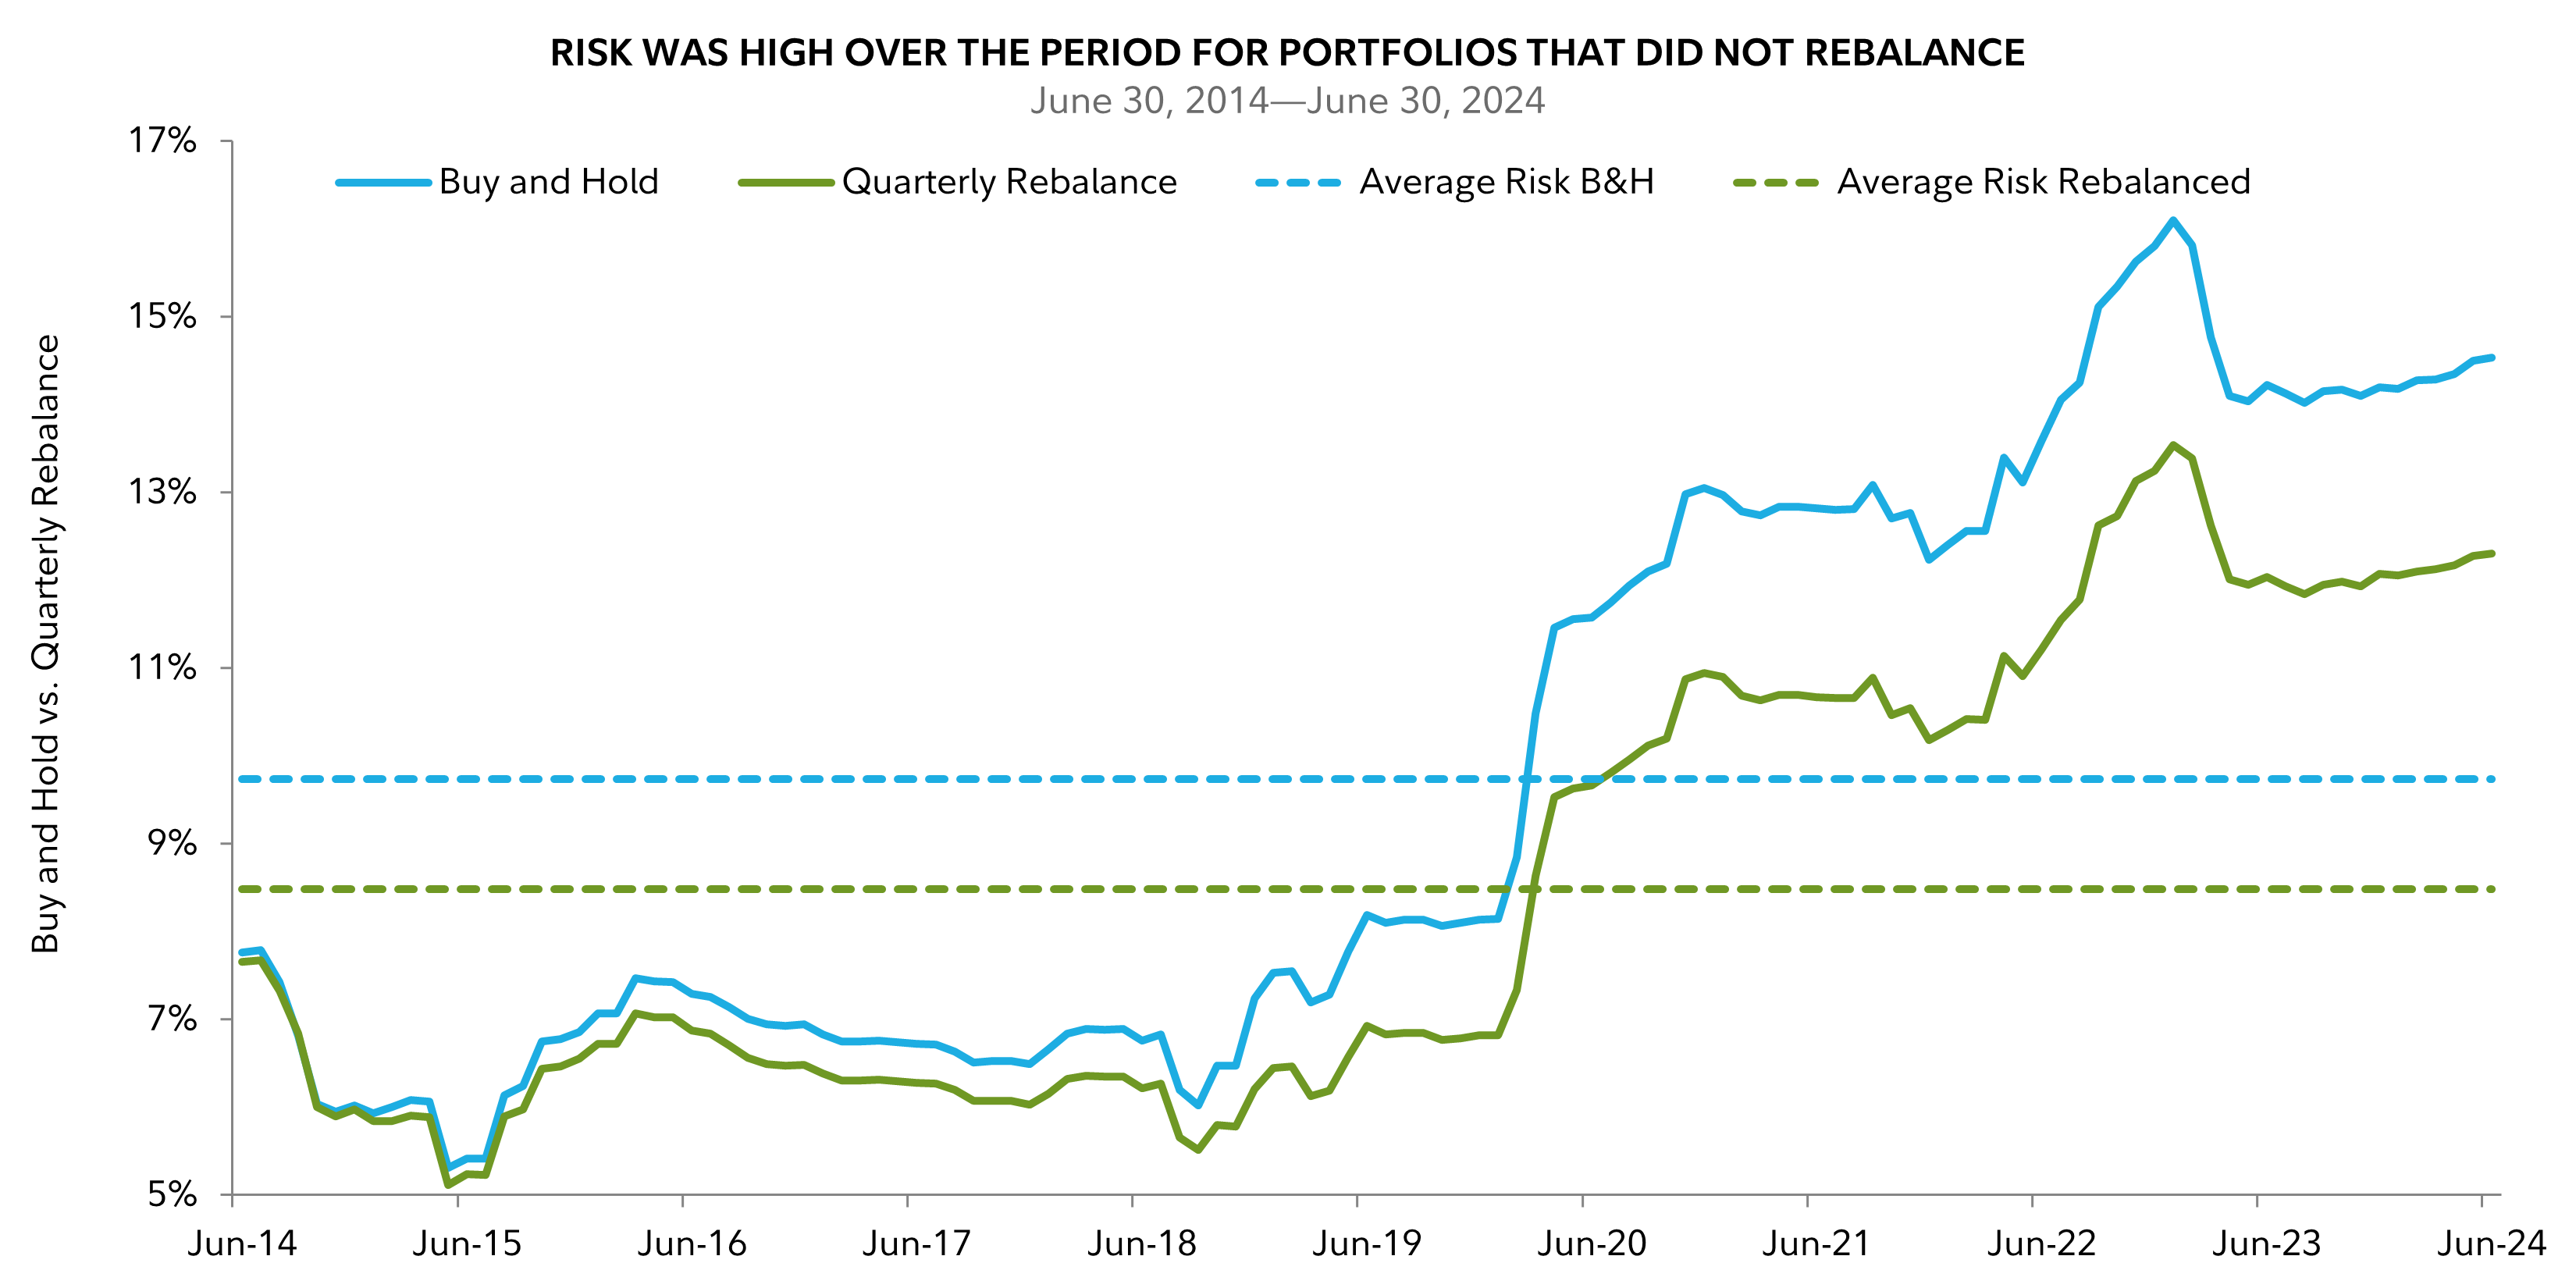
But more importantly, over this 10-year period the amount of risk inherent in the portfolio changed as well. The second graphic shows how risk, measured by variability of returns, increased over time as the portfolio drifted from its original asset allocation. As you can see, the longer an investor goes without rebalancing the more risk may increase.
These charts are for illustrative purposes only and is not indicative of any investment. A portfolio that is not diversified within asset classes may experience different levels of risk. Portfolio risk is measured using standard deviation, which is a statistical measure of how much a return varies over an extended period of time. The more variable the returns, the larger the standard deviations. Investors may examine historical standard deviation in conjunction with historical returns to decide whether an investment’s volatility would have been acceptable given the returns it would have produced. A higher standard deviation indicates a wider dispersion of past returns and thus greater historical volatility. Standard deviation does not indicate how an investment actually performed, but it does indicate the volatility of its returns over time. Standard deviation is annualized. The returns used for this calculation are not load adjusted.
Average risk for the Buy and Hold portfolio and the Quarterly Rebalanced portfolio is the average of the monthly rolling 3 year standard deviations for the period in the chart.
Portfolio allocations:
U.S. Stocks: S&P 500 Index – 42%
International Stocks: MSCI ACWI ex USA Index (Net MA Tax) – 18%
Bonds: Bloomberg: U.S. Aggregate Bond Index – 35%
Short Term: Bloomberg U.S. 3‐Month Treasury Bellwethers Index – 5%
The holdings of the Quarterly Rebalance portfolio were rebalanced on a quarterly basis back to the Initial Index Weightings for each Primary Asset Class. The holdings of the Buy and Hold portfolio were never rebalanced.
Bloomberg U.S. Aggregate Bond Index: A broad‐based, market value–weighted benchmark that measures the performance of the U.S. dollar–denominated, investment‐grade, fixed‐rate, taxable bond market. Sectors in the index include Treasuries, government‐related and corporate securities, mortgage‐backed securities (MBS) (agency fixed‐rate and hybrid ARM pass‐throughs), asset‐backed securities (ABS), and commercial mortgage‐backed securities (CMBS).
Bloomberg U.S. 3 –Month Treasury Bellwether Index: A market value–weighted index of investment‐grade fixed‐rate public obligations of the U.S. Treasury, with maturities of three months, excluding zero coupon strips.
The S&P 500® Index is an unmanaged, market capitalization–weighted index of 500 common stocks chosen for market size, liquidity, and industry group representation to present U.S. equity performance.
The Morgan Stanley Capital International All‐Country World Index (MSCI ACWI ex USA Index (Net MA Tax)) is a market capitalization–weighted index designed to measure the investable equity market performance for global investors of large‐ and mid‐cap stocks in developed and emerging markets, excluding the U.S. Index returns are adjusted for tax‐withholding rates applicable to U.S.‐based mutual funds organized as Massachusetts business trusts.
Reallocating, or adjusting the amount of risk within each asset class in your portfolio, is an important part of managing your investments in response to changes in the economy. Remember, not all types of stocks and bonds perform the same way in all market and economic conditions.
While the example below is hypothetical, it provides some idea of how different types of investments perform differently as the economy moves from late-cycle into the early onset of recession. Allocation decisions may vary even within one phase of the business cycle as conditions change. As an investor managing your own portfolio, you'll want to be mindful of these relationships not just during a recession, but during periods of economic expansion as well.
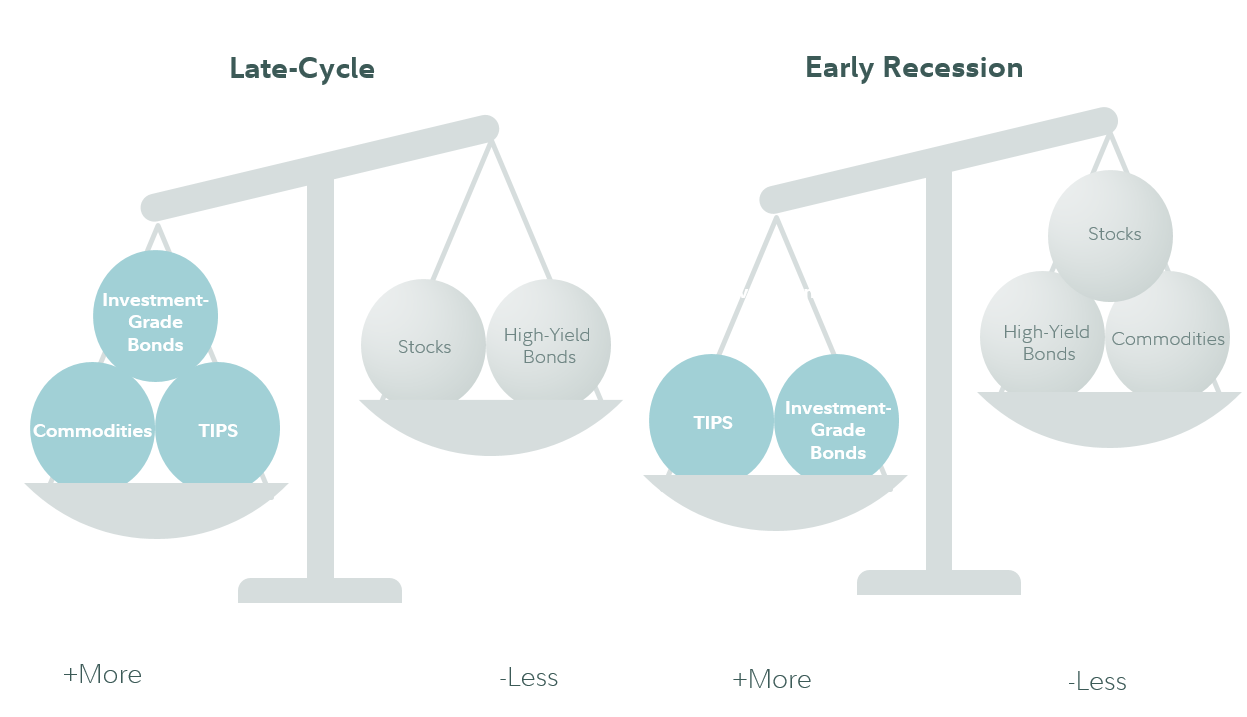
The next strategy that can help you maintain a heathy portfolio is reallocation. It's important to reallocate appropriately, as an investor's asset allocation can change over time based on active allocation decisions and the economy. Here's an example of how Fidelity might consider reallocating an investment portfolio during a late-cycle:
- During late-cycle, typically we seek to gradually reduce risk.
- We may increase the amount of investment-grade bonds, as they tend to provide stability during late-cycle expansions.
- Additionally in late-cycle, we may increase exposure to commodities and TIPS, as they could provide protection against inflation as the economy matures.
- Through the onset of recession we seek to reduce risk. Therefore, we may gradually decrease the amount of stocks, commodities and high yield bonds, as they tend to experience more frequent periods of volatility.
- Reallocation strategies like these can help keep you aligned to your long-term financial goals, even when faced with economic down-turn.
If you're looking for ways to keep more of what you earn in your taxable accounts, there are a number of techniques you can apply, some as early as the day you fund your account. At Fidelity, we employ a series of tax-smart investing techniques.1 As an investor managing your own portfolio, you may want to consider looking for opportunities to apply these techniques.
Taking a tax-smart approach, for any taxable accounts you own, is designed to help you keep more of what you earn. As an investor, you'll want to be on the lookout for opportunities to apply these techniques.
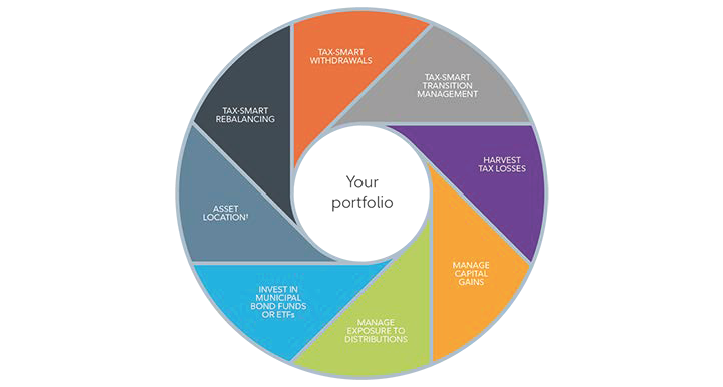
Transition management: When building a portfolio, look for ways to integrate existing holdings into your selected investment strategy to avoid having to sell securities, which creates tax consequences.
Tax-loss harvesting: By selling securities in which you have losses, you may be able to offset gains you have in other securities you've sold.
Manage capital gains: When selling investments, look to first sell those that you've held for a longer time period, allow you to take advantage of lower long-term capital gains rates.
Manage distributions: Look for ways to manage your exposure to income distributed by the mutual funds in which you're invested, due to either capital gains or because the securities held by those funds pay dividends or interest.
Invest in municipal bonds: When it makes sense, you may want to consider municipal bond funds that generate interest that may be exempt from federal taxes and, in some cases, state taxes.
Tax-smart withdrawals: If you regularly withdraw money from your account, it may make sense to keep cash on hand to avoid having to sell securities. And if you do have to sell securities, be mindful of the tax consequences of these sales.
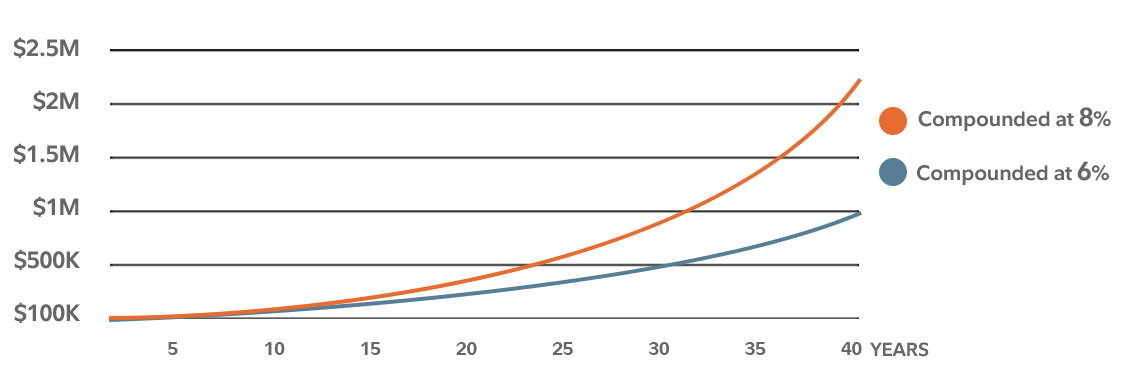
Potential impact of taxes over time
1: Tax-smart (i.e., tax-sensitive) investing techniques (including tax-loss harvesting) are applied in managing certain taxable accounts on a limited basis, at the discretion of the portfolio manager primarily with respect to determining when assets in a client's account should be bought or sold. As the discretionary portfolio manager, Strategic Advisers LLC ("Strategic Advisers") may elect to sell assets in an account at any time. A client may have a gain or loss when assets are sold. There are no guarantees as to the effectiveness of the tax-smart investing techniques applied in serving to reduce or minimize a client's overall tax liabilities, or as to the tax results that may be generated by a given transaction. Strategic Advisers does not currently invest in tax-deferred products, such as variable insurance products, or in tax-managed funds, but may do so in the future if it deems such to be appropriate for a client. Strategic Advisers does not actively manage for alternative minimum taxes; state or local taxes; foreign taxes on non-U.S. investments; federal tax rules applicable to entities; or estate, gift, or generation-skipping transfer taxes. Strategic Advisers relies on information provided by clients in an effort to provide tax-sensitive investment management, and does not offer tax advice. Except where Fidelity Personal Trust Company (FPTC) is serving as trustee, clients are responsible for all tax liabilities arising from transactions in their accounts, for the adequacy and accuracy of any positions taken on tax returns, for the actual filing of tax returns, and for the remittance of tax payments to taxing authorities.