Fixed Income Dashboard

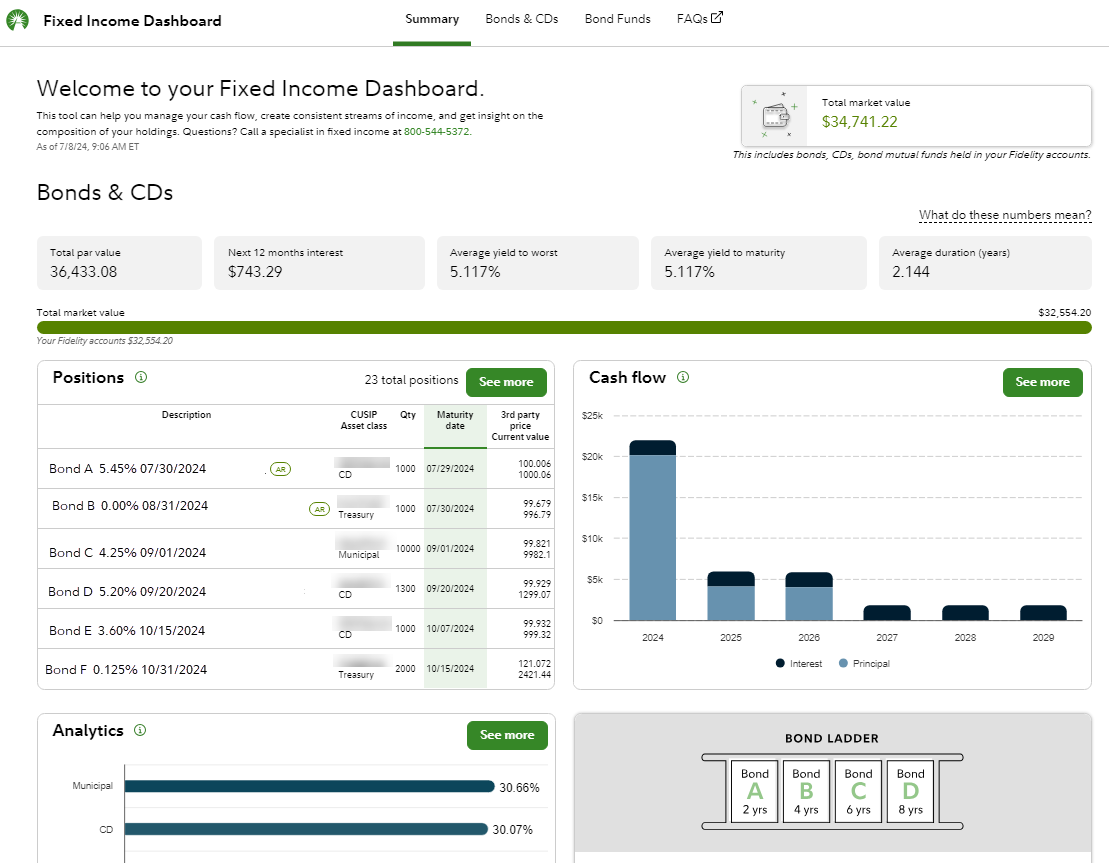
Fidelity's Fixed Income Dashboard can help you manage cash flow and understand the composition of your fixed income portfolio.

Questions?

Key features

Summary page
  • Scan the Summary page for an overview of your fixed income portfolio held at Fidelity, including its latest valuation and upcoming maturities.
  • From the Summary page navigate for a closer look at all your fixed positions, their cash flows, and key analytics such as duration and tax exposure.
  • The Summary page can also be your hub from which keep track of any bid requests or to build a bond or CD Ladder.

Fixed Income Dashboard Fixed Customize your view
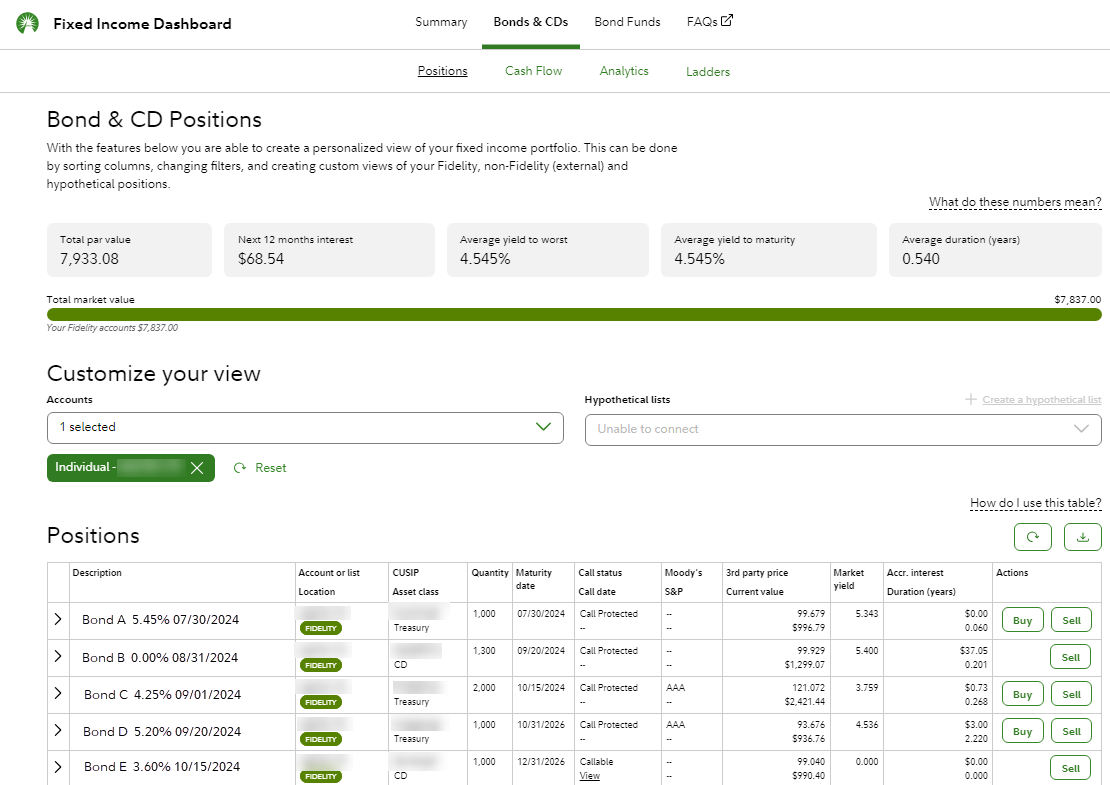
Fixed income positions
  • View up to 1,000 holdings by portfolio, account or list.
  • Create lists using Fidelity holdings, outside holdings and hypothetical positions.
  • See detailed information about your Fidelity holdings, including accrued interest, duration and acquisition information.

Fixed Income Dashboard Fixed Income Positions Page
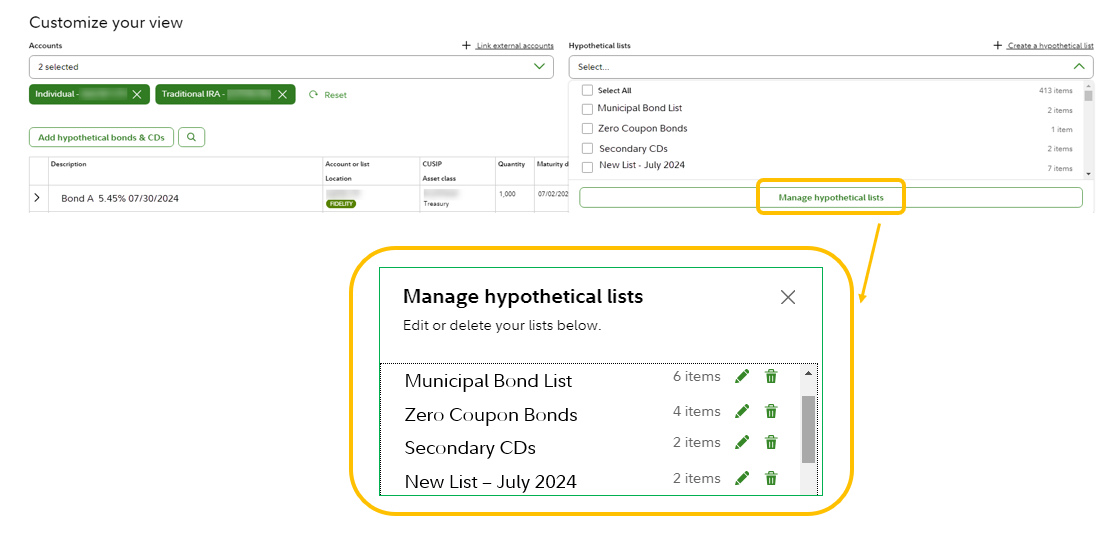
Customize your view
  • The initial view and calculations will be based upon your bonds and CDs held in your Fidelity accounts.
  • Remove or add specific accounts and hypothetical lists using the drop down menus.

Fixed Income Dashboard Fixed Customize your view
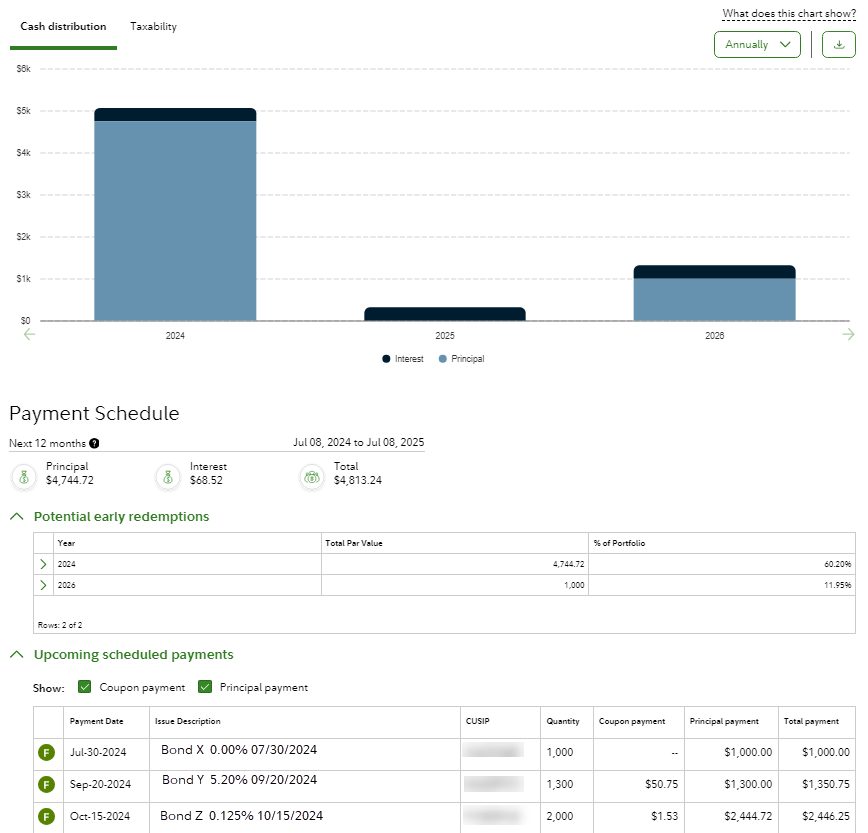
Cash flow calculations
  • View upcoming annual or monthly cash flow.
  • Sort upcoming scheduled payments to see just coupons, principal payments, or both.

Fixed Income Dashboard Cash Flow
Analytics

The analytics charts can help you identify different types of risk or diversification opportunities within your portfolio, such as
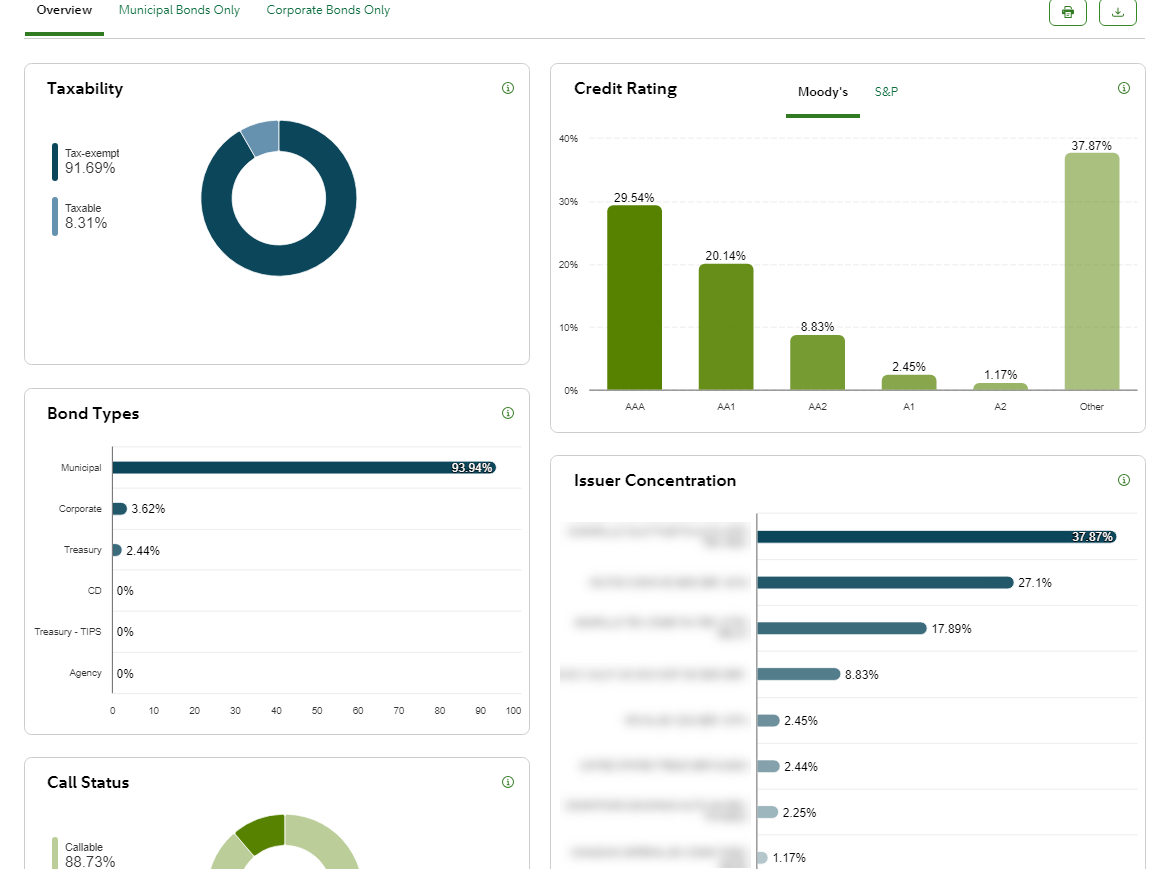

  • Moody's and S&P Credit rating
  • Taxability
  • Sector exposure
  • Issuer concentration
  • Duration
  • FDIC concentration

Fixed Income Dashboard Analytics